If you have used Google Analytics 4 & Univeral Analytics for your website behavior and analytical needs, you would know the pain of seeing so little data in GA4.
The out-of-the-box configuration of UA was helpful for website user behavior and many other things. With GA4, you have to fine-tune everything manually, and essential bridges connecting user touchpoints are still missing. Even if you are an advanced GA4 user, you can’t fill some of those gaps.
But there is a silver lining in all of this.
Because GA4 has moved to a different data model that primarily depends on events instead of sessions, it has become a really powerful tool for customizing user behavior tracking to improve websites or web applications.
What you’ll get from here
So, I created a dashboard with topline stats for the owner of a new e-commerce brand. They’ve just set up their website on WordPress and WooCommerce and want to track bottom-line metrics along with user behavior on the website.
Your takeaways can be:
- How to set up GA4 tracking for a WooCommerce shop.
- Use Google Tag Manager, custom events, and data layer variables together to send data to GA4 from your WordPress & WooCommerce shop.
- How to set up an e-commerce dashboard in Looker Studio with simple website performance and bottom-line metrics.
If you’re inquisitive, your major takeaway can be using custom events in GTM, the website’s data layer (or your web app), to set up micro-level tracking for your business. There is no limit to what you can derive from the data you get from custom tracking.
Every tool I’ve used here is free. This was a good opportunity to get the GTM and GA4 basics right, so I am sharing these with the most straightforward explanation possible.
You can alternatively use out-of-the-box analytical products like MixPanel or Amplitude if your setup is custom (more relevant for PWAs).
WooCommerce also offers an analytics module built-in so that you can measure your shop performance from there.
The Final Looker Studio Dashboard
So here is a simple dashboard that shows revenue and product data. The first page shows revenue metrics, giving stakeholders an overview of how sales impact the business’s bottom line.
The next page is more into products and product categories, which made more sense than other metrics because the business outsources products in a few categories.
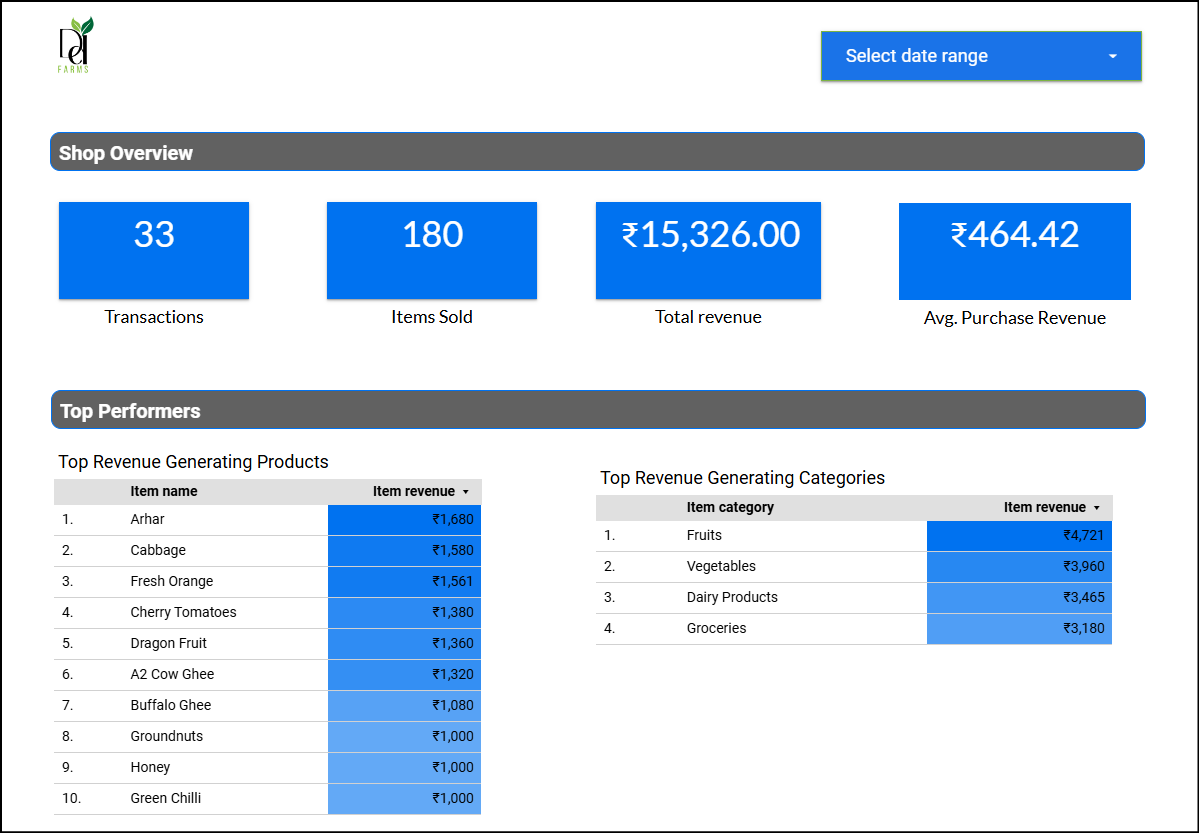
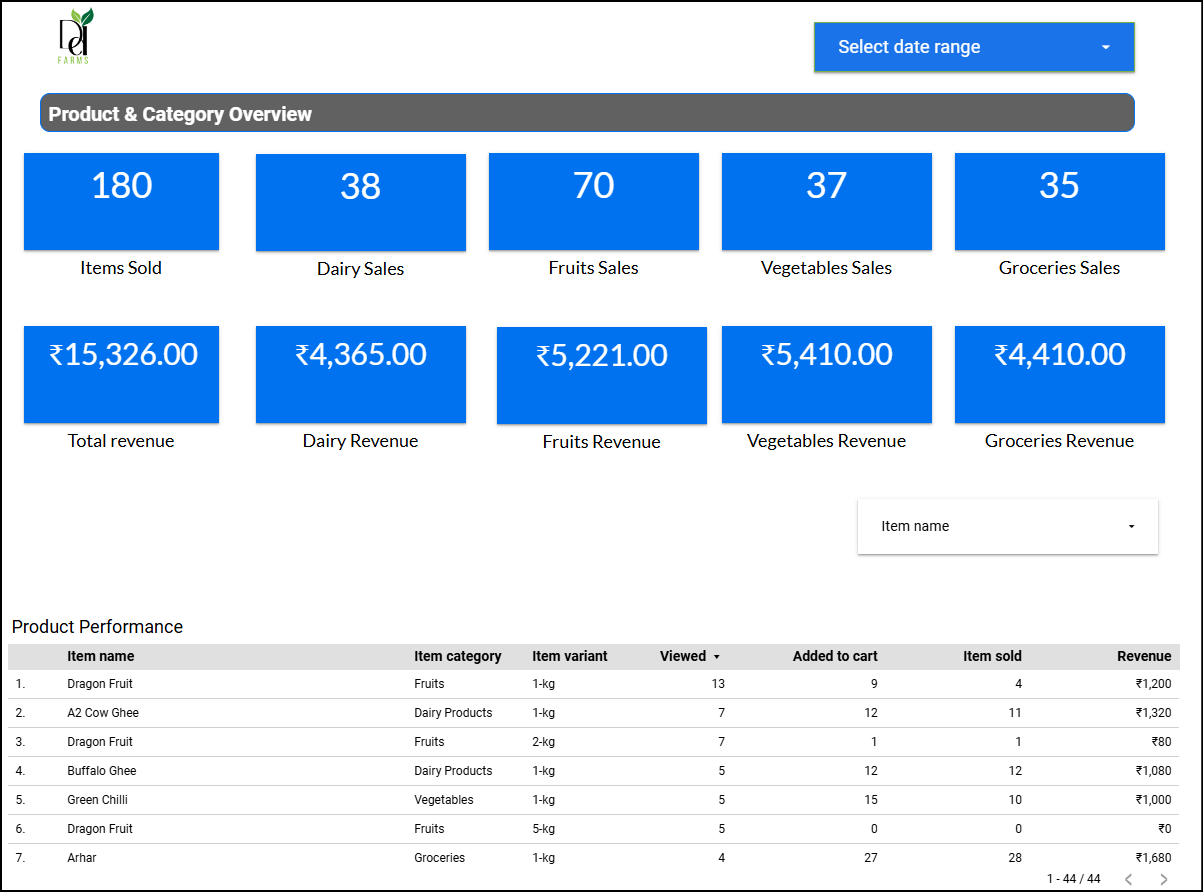
Note: For simplicity, this is a derived dashboard from the original one I created for DD Farms. We’ll use this to explain the setup.
The data is sourced from the WordPress + WooCommerce website using Google Tag Manager and Google Analytics.
Metrics & KPIs
Shop Overview (First Page)
Metrics:
- Transactions
- Items sold
- Total Revenue
- Average purchase revenue (or Average order value)
Tables:
- Top revenue-generating products
- Top revenue-generating categories
Product and Category Performance (Second Page)
Metrics:
- Total items sold
- Total revenue
- Dairy sales
- Dairy Revenue
- Fruit sales
- Fruit revenue
- Vegetable sales
- Vegetable revenue
- Grocery sales
- Grocery revenue
Table
- Product performance
The actual report has many more pages and more data. It has advanced calculated fields along with other cost data that I have not included to avoid going on a tangent.
How Does the Tracking Work?
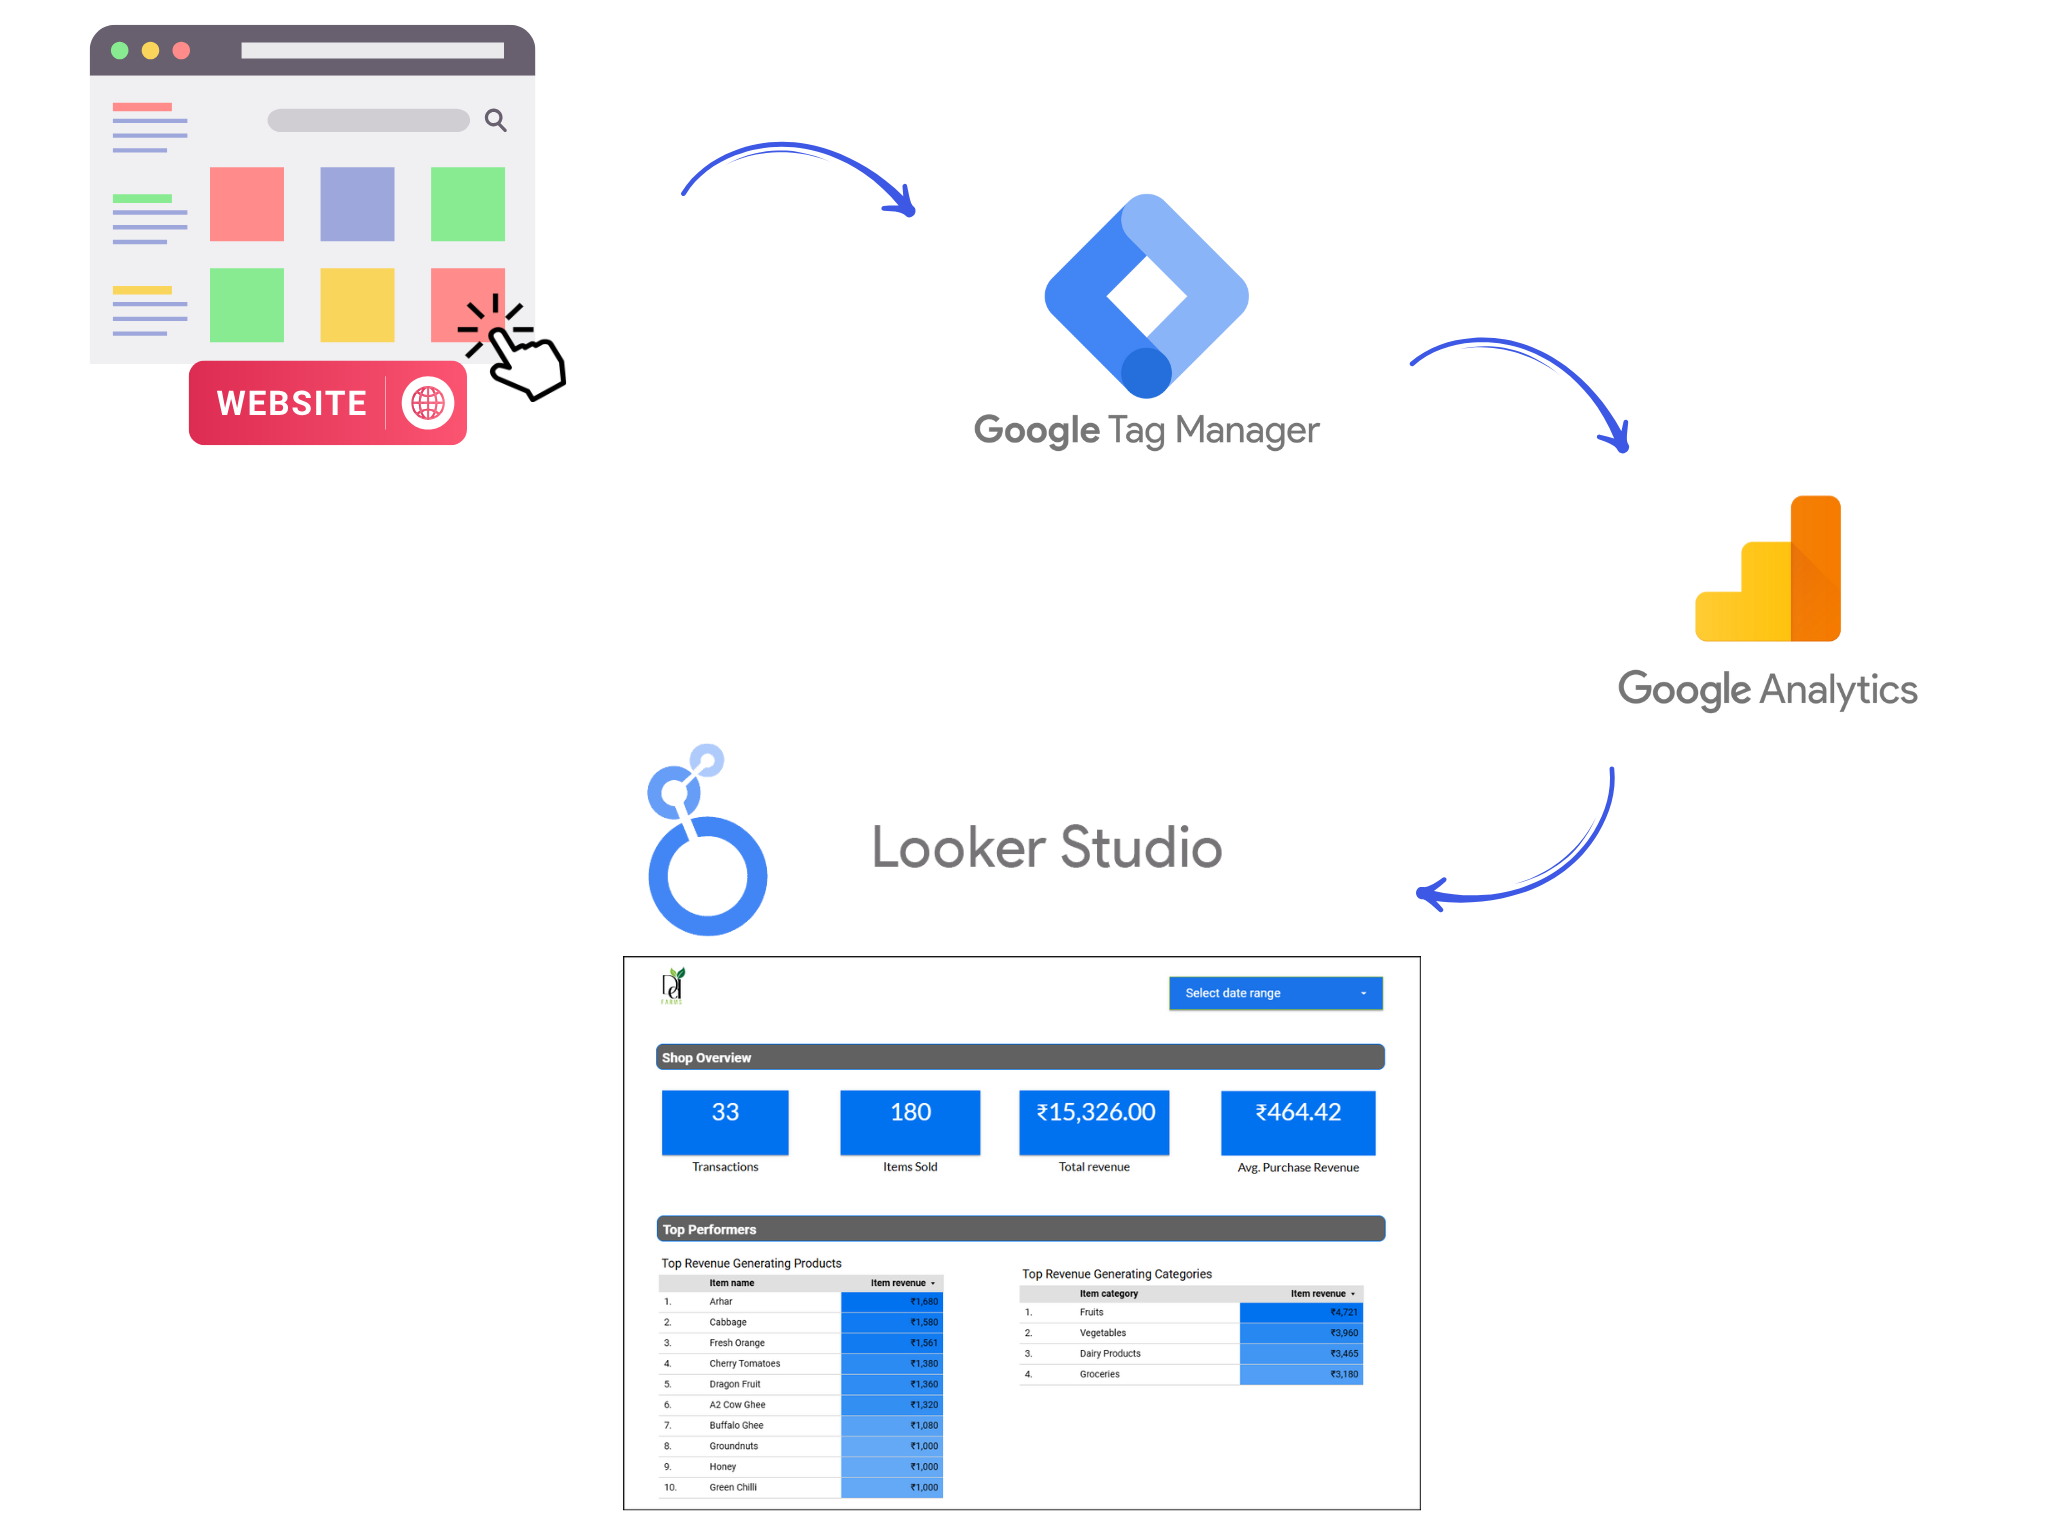
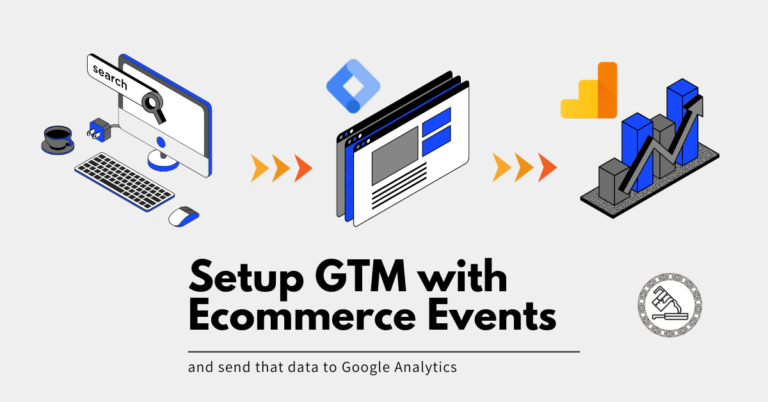
So the tracking works like this:
Recognize User Activity
Imagine someone visiting your online store. Every action they take—like scrolling down a page, clicking on a product, or adding items to their cart—can be recorded as an event. These events help you understand user behavior.
Send Event Data to the Data Layer
Think of the data layer as a big storage box. This information is added to the box whenever someone acts (an event).
Let’s say a customer fills out a form with their email and clicks ‘submit.’ The website pushes an event to the data layer, like:
dataLayer.push({
'event': 'formSubmit',
'formType': 'newsletterSignup',
'formEmail': '[email protected]'
});
Use Google Tag Manager (GTM)
GTM is a tool that helps manage and track these events. You tell GTM what data to look for in the storage box and what to do with it.
In GTM, you can create a data layer variable called DLV-formEmail to capture the email address:
- Variable Name:
DLV-formEmail - Data Layer Variable Name:
formEmail
Data layer variables in GTM help you identify specific pieces of information in the data layer. For example, if you want to track when a user fills out their email, you define a variable called formEmail.
When you push the above code from your website, GTM reads this action from the data layer (our storage box).
Step 4: Set up Tags and Triggers in GTM
GTM’s main job is to take action (like sending data) when certain conditions are met. For instance, you can tell GTM, “When someone submits a form, send this information to Google Analytics (GA4).”
Tags: These are pieces of code that send information to other services, like Google Analytics.
Triggers: These are conditions that tell GTM when to fire the tags. For example, you can set a trigger to fire a tag when a form is submitted.
You can create a trigger to fire on form submissions:
- Trigger Type: Custom Event
- Event Name:
formSubmit
You can use a tag to send this data to Google Analytics (GA4):
- Tag Type: GA4 Event Tag
- Configuration Tag: Your GA4 Measurement ID
- Event Name:
form_submit - Event Parameters:
- Parameter Name:
email - Value:
{{DLV-formEmail}}
- Parameter Name:
Now, GTM checks if the condition you set (form submission) is met. If it is, GTM sends this data to GA4.
Send data to GA4 for processing
GA4 then processes this data, which you can use to analyze your website’s performance. You can use this data in reports.
If you want to use this data in exploration reports, you need to register the new variables you configured in GTM (DLV-formEmail) as a dimension in GA4 by going to custom definitions.
Connect Looker Studio to GA4
GA4 might be tricky to report so that you can connect it with Looker Studio. This tool lets you create reports and dashboards from the GA4 data.
Create Reports in Looker Studio
Looker Studio gathers all the data, giving you an empty canvas to build reports and visualizations. You can make charts, tables, and graphs to see how well your website is doing and share these reports with others.
Example Scenario
- A user visits your WooCommerce site and browses products. Every click and scroll can be tracked.
- This activity is stored in the data layer.
- You set up GTM to capture these activities.
- In GTM, you create a variable called
product_clickto track clicks on products. - You tell GTM, When
product_clickhappens, send this info to GA4. - A user clicks on a product; GTM reads this from the data layer.
- GTM checks the condition (product click) and sends the data to GA4.
- GA4 processes this data.
- You link GA4 to Looker Studio for easier report creation.
- You create a report showing which products are clicked the most.
TL; DR
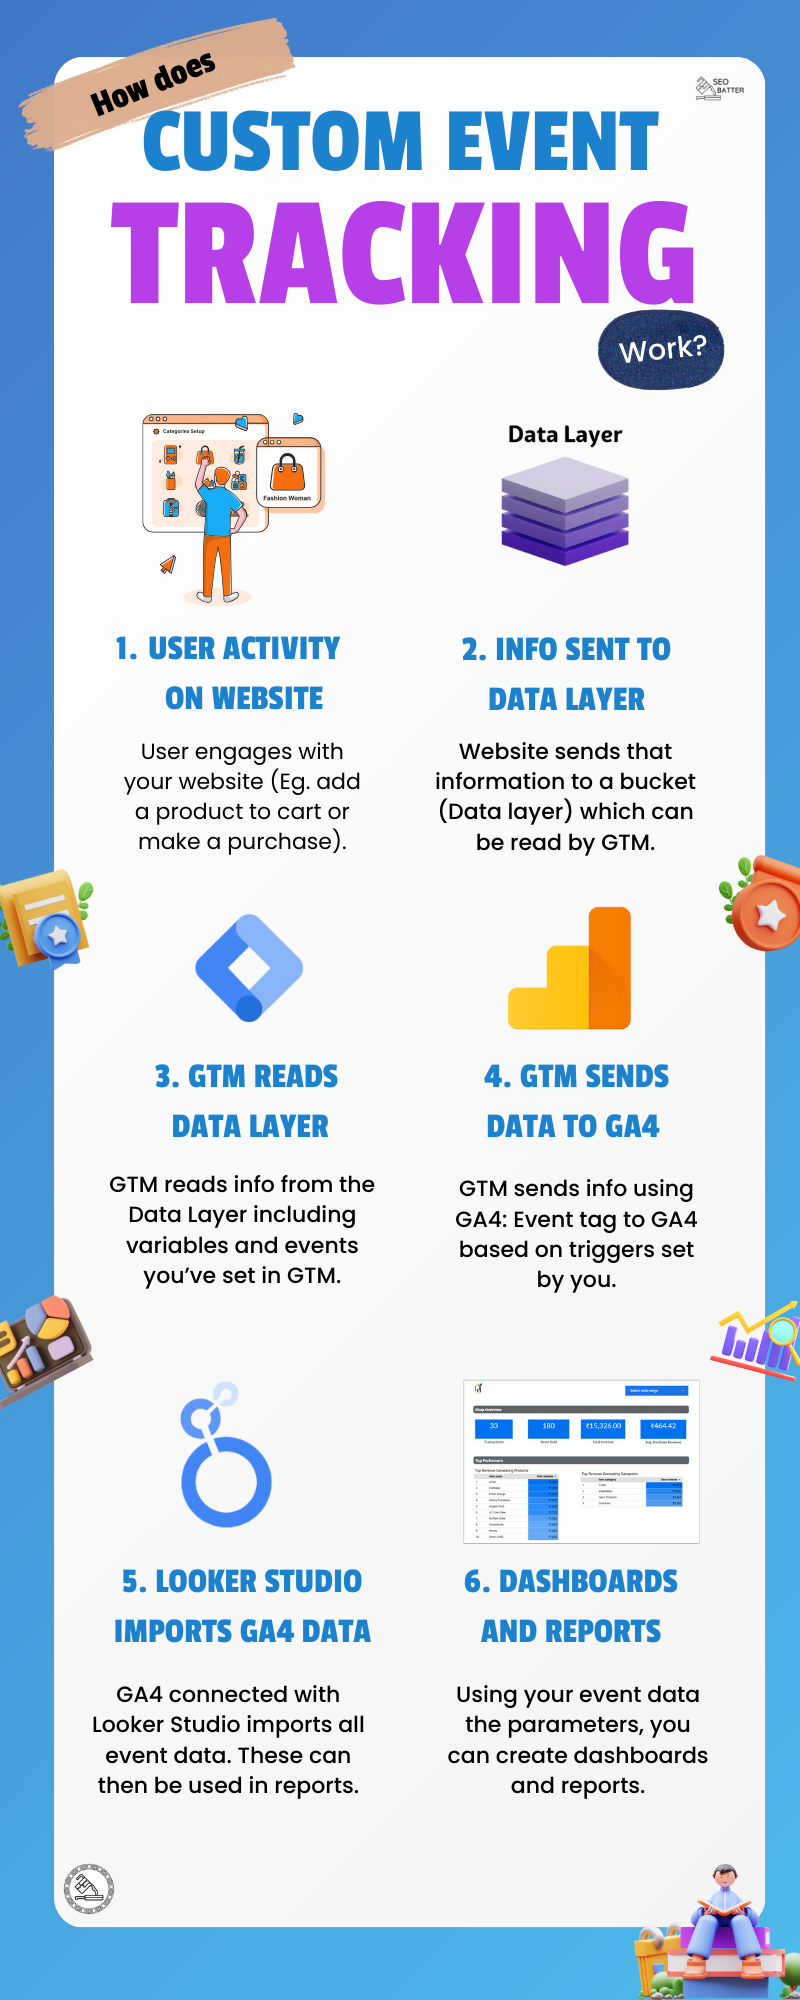
I don’t know about you, but it took me a while to figure it all out. To go all in and help every one of you understand from the beginning, I’ll document every step.
Because this post was getting long, I’ve created separate posts for complete steps and mentioned the most important things here. You can navigate to each post to get more clarity on the setup.
Each linked post has complete steps and explanations for our purpose of setting up the tracking to create the reports.
Step 1: Setup your Wocommerce website with GA4 and GTM
You need to connect your website with a GA4 property and connect to Google Tag Manager.
GA4 reads activity on your site and sends some automatic events. Once GA4 is connected, custom events such as e-commerce purchases can also be sent.
Google Tag Manager helps connect GA4 to your website. We will connect GA4 through GTM. GTM will also be used to configure e-commerce events.
As mentioned before, GTM sends Google Analytics information, so your website needs to be set up with both GTM and GA4.
Step 2: Configure Your WooCommerce Store to Send ECommerce Events to the Data Layer
Your website should send information to the data layer whenever user activity occurs on your woocommerce shop. This would further be used for GTM and GA4 to process and give you the needed data.
Because WooCommerce uses WordPress, you can use free WordPress plugins, making this easier.
Step 3: Set up Google Tag Manager to Read Ecommerce Data Layer Events and Send them to Google Analytics
Now that you’ve configured your website to send events to the data layer. You must configure GTM to understand those events and send that information to Google Analytics.
This post explains how the tracking in GTM works. It is an optional read for your current purpose.
Other use cases of custom event tracking:
- Tracking form submissions from start to finish
- Book a call journey from CTA to booking a date.
- Website page funnels
- Web apps – Track all clicks and feature usage, and explore users with user IDs.
Create an e-commerce Shop Performance Dashboard in Looker Studio
You can import all your data from Google Analytics and visualize it in Looker Studio. The data will be imported as events, dimensions, and metrics, which can then be used to present a coherent E-commerce shop performance dashboard.
References
- Data layer push – How does pushing values to the data layer work
- Data layer – what is the data layer ,and how to use it
- Data layer implementation on the website – Stape.io
- Google Tag Manager for WordPress – GTM4WP WordPress plugin
- Measure e-commerce – how to implement e-commerce events through GTM
- GA4 events in GTM
- GA4 dimensions and metrics
- Sample website to get Data Layer code
Credits to Avinash Reddy from Anywhere Works, who taught me how to use Google Tag Manager and GA4 to track activity on any web app or website.

