
This post will be helpful if you’re looking to:
- Create a content performance report – Identify winning content and opportunities for improvement for Google search.
- Merge Google Analytics 4 and Google Search Console Data
- Create a looker studio report with combined metrics from GA4 and GSC.
- Separate your blog performance from the rest of your website landing pages.
- Identify engagement on your pages that are ranking well/poor on organic search.
I created this detailed guide to combine GA4 and GSC data because I had to report on a few metrics to stakeholders on new blog pages that I recently published. The idea was to see if our topic selection, content quality, and intent were right for our target audience.
With hours of research on how to do this, the closest I could find was Looker studio templates that were paid. But even that wasn’t promising in terms of what I sought.
So here it goes:
Introduction
The guide is structured to have four sections:
- Basics on what we’re trying to do here, along with the ‘why’ and benefits. This would help you sell the importance of this report to your stakeholders.
- Instructions on how to blend Google Analytics [GA4] and Google Search Console [GSC] data in Looker Studio.
- Some tips on how to use the template, analyze the data, derive insights, and build action items based on your findings.
- Learnings, noted issues, etc.
For this activity, you need access to a Google Analytics property and Google search console access of the same domain.
Content Performance on Organic Search: Why does it matter?
After publishing new website pages – you’d want to understand how they perform.
You can easily use metrics from the Google search console, such as impressions and clicks, to compare the current period with the previous period.
But if you’re looking to audit and optimize the page, those metrics might not be enough. Wouldn’t you wonder if people are spending enough time on that page?
Metrics such as clicks are second-order metrics- they tell you that you’ve got people coming to your page.
But you do not know if people are interacting with your page at all (if that was your goal) or if they have all completed a key conversion (leads/registration, etc.).
You then turn to Google Analytics or a session recording app for help. From Google Analytics, you can filter organic traffic in GA4, see landing pages and screen reports, and get user engagement metrics.
But then:
How do you see this information together?
If you’re selecting the best performance pages from GSC and analyzing their GA4 metrics, aren’t you missing out on pages with more meaningful visitor impact but not ranking as high?
You need to:
- Have a zoomed-out view of all of your pages and analyze how they are doing SEO-wise and engagement-wise – together!
- Track user engagement and organic ranking data to derive insights for page optimizations.
What can you expect to find?
You might find some pages that have a high engagement rate for people reading the article, but you don’t have enough keyword positions on Google search for it to rank organically.
You can then create a plan for promoting that high-engagement piece across Google search and other channels.
Out of 100s of website pages, you can get insights from the report like the one we’re going to create below.
Enters Looker studio
Looker Studio helps you visualize your marketing data and create dashboards. You can connect your Google Analytics and Search console property as a data source in Looker Data Studio to create reports that matter.
This allows you to merge two data sets (GA4 and GSC), which is called blending in Data Studio.
With blended data GA4 and GSC data, you can create a simple table showing you Google search performance metrics and user engagement metrics from GA4.
According to your use case, you can also add other metrics from GA4, such as e-commerce add-to-cart or purchases from a page, number of events (if you’re tracking different events for a similar set of pages), DAU/WAU/MAU if you’re tracking app pages, and Publisher Ad clicks/impressions if you’ve connected your Adsense/ Admob account to your GA4 account.
You can also filter organic traffic in Looker Studio from your GA4 dataset.
There are two alternatives to this approach:
- You can do manual reporting in Excel sheets. I have done that and honestly hated it for every week I had to put in the numbers manually. Manual data entry work for that report increased with each new page added or updated.
- You can create exploration reports in GA4 with a connected Google search console property. I like this option until I have to share this report with the stakeholders. You do not want to ask them to look at the nth report and determine if they have access and the steps to access that particular report inside GA4. Though you have better-quality data, there are fewer customization options in the exploration section of GA4 compared to Looker Studio.
How to Combine GA4 and GSC Data
Know how to combine Google Analytics and Google Search Console data in Looker Studio.
The secret here is understanding that you need to have a base (a key) to merge these datasets. Looker Studio uses data from database tables with a field name (key) and a field ID (Key ID). You need to make both of these uniforms to be able to merge the two using a standard Key.
Connect GA4 and GSC as data sources in Looker studio
If you haven’t already done so, connect your Looker studio to your Google Analytics property and Google Search Console property.
Connect Google search console to Looker studio
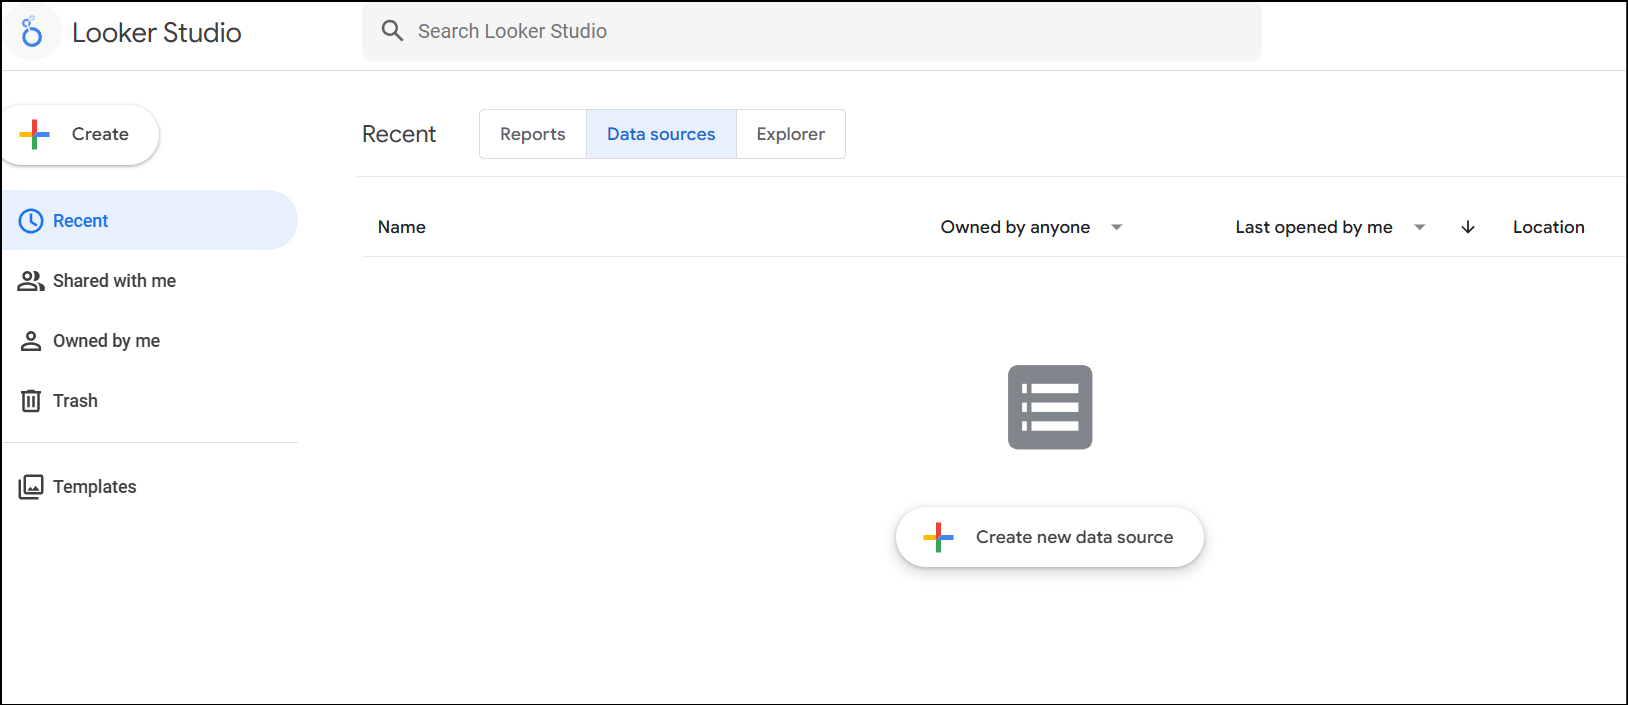
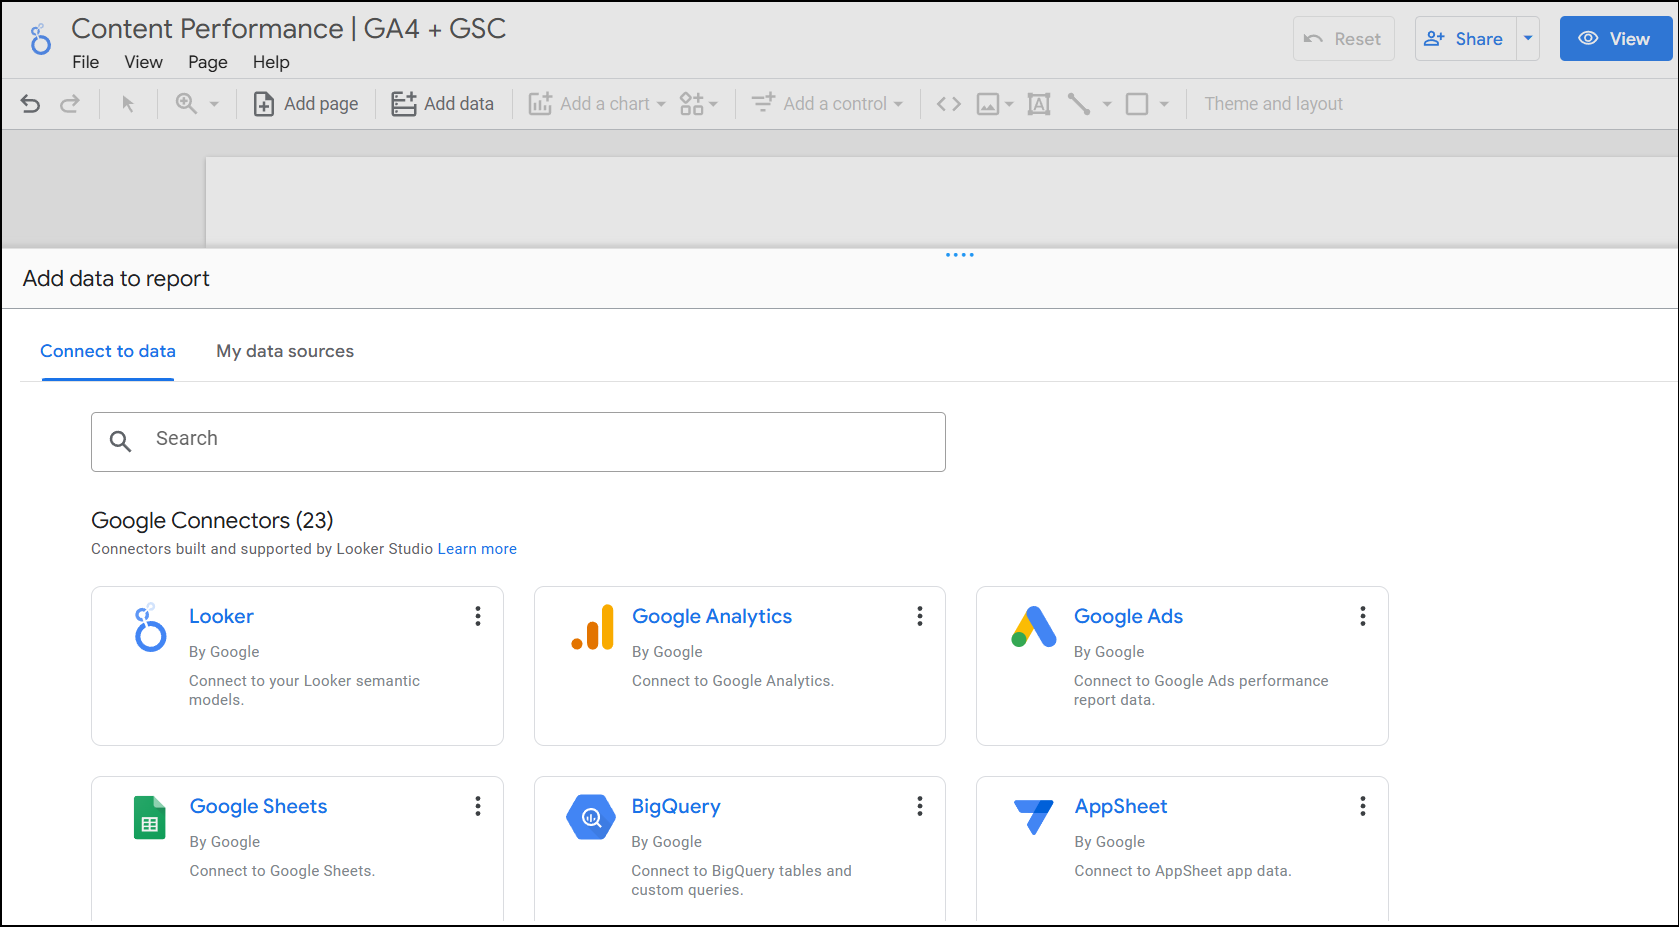
To connect GSC data to Looker Studio, go to the “Data sources” tab. Select “Connect new data source” and then select Search Console from the list of Google connectors.
Your search console property will appear in the right sidebar. Now select that property, and you’ll see two options: “Site impressions” and “Url impressions.”
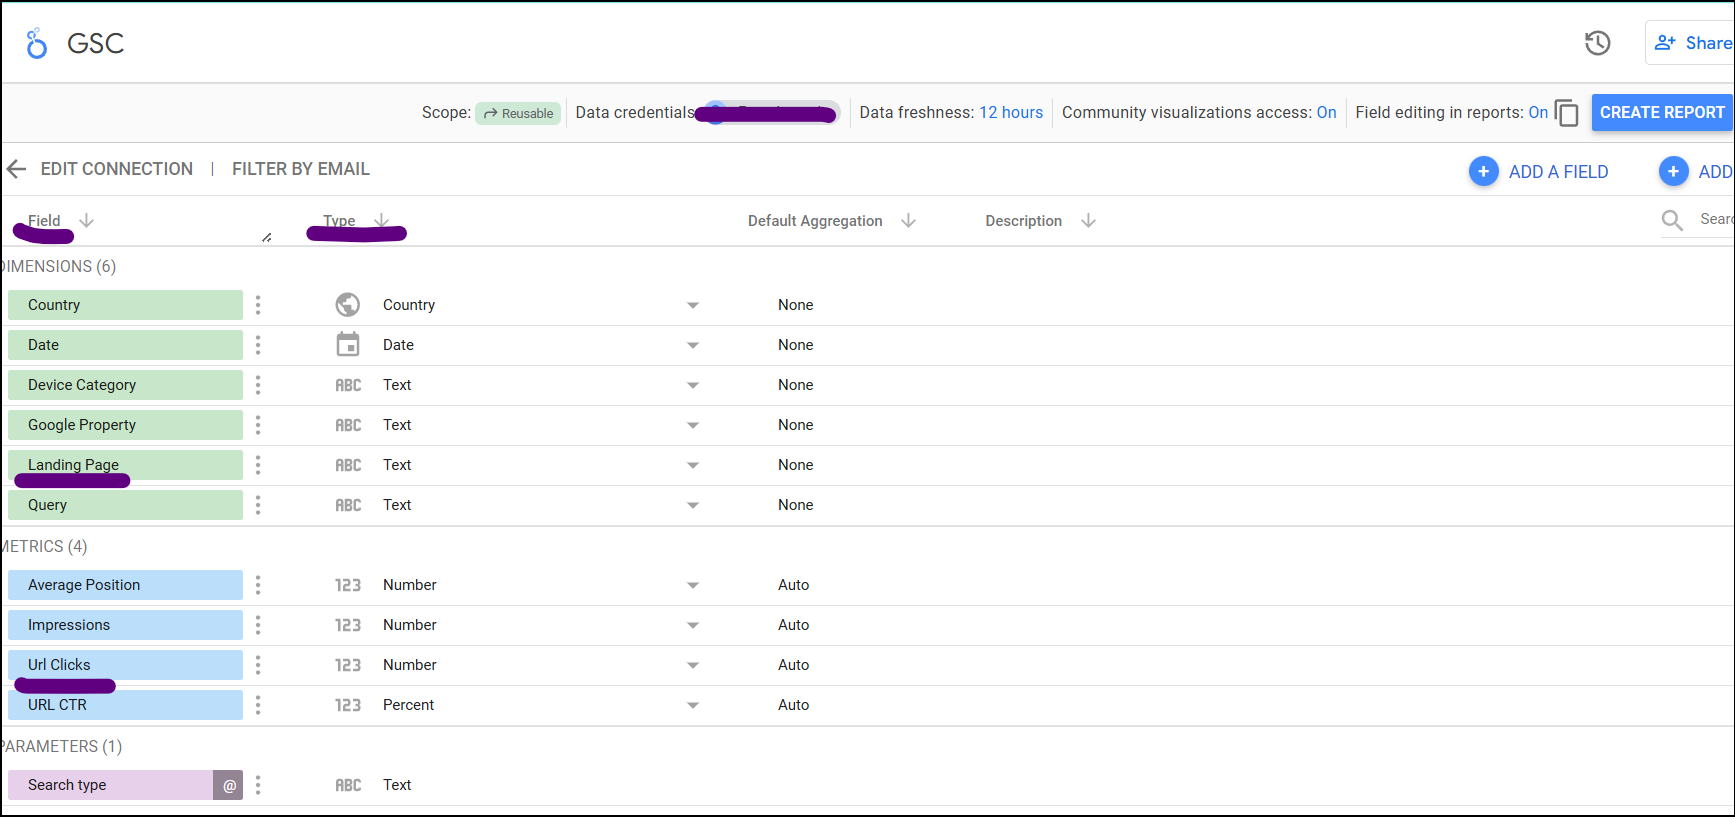
While adding the Search console property, select “Url impressions” as the dataset. This dataset is most useful since it contains all the URLs and Query dimensions and metrics such as clicks, impressions, position, etc.
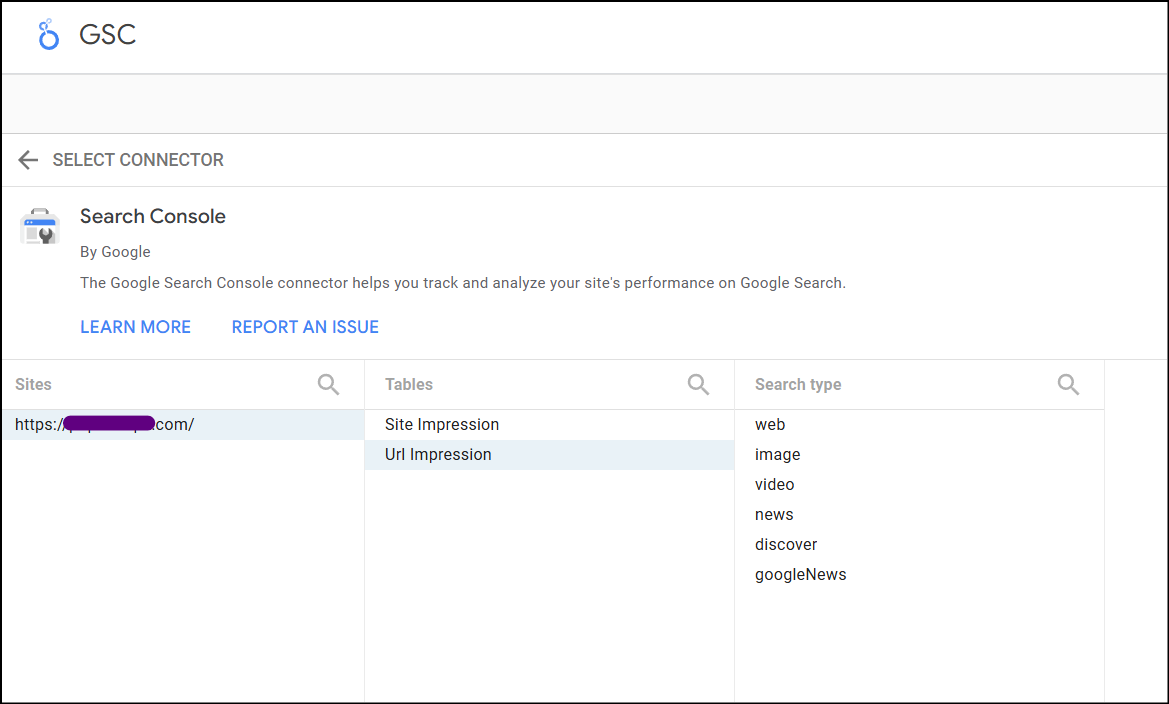
The “Site impressions” dataset doesn’t have queries attached to the URLs. You need queries with URLs set to drill down and identify queries ranking for that page.
Connect Google Analytics to Looker Studio
To connect GA4 data to Looker Studio, go to the “data sources” tab. Since you’ve already added GSC data there, you won’t see the “Connect new data source” option.
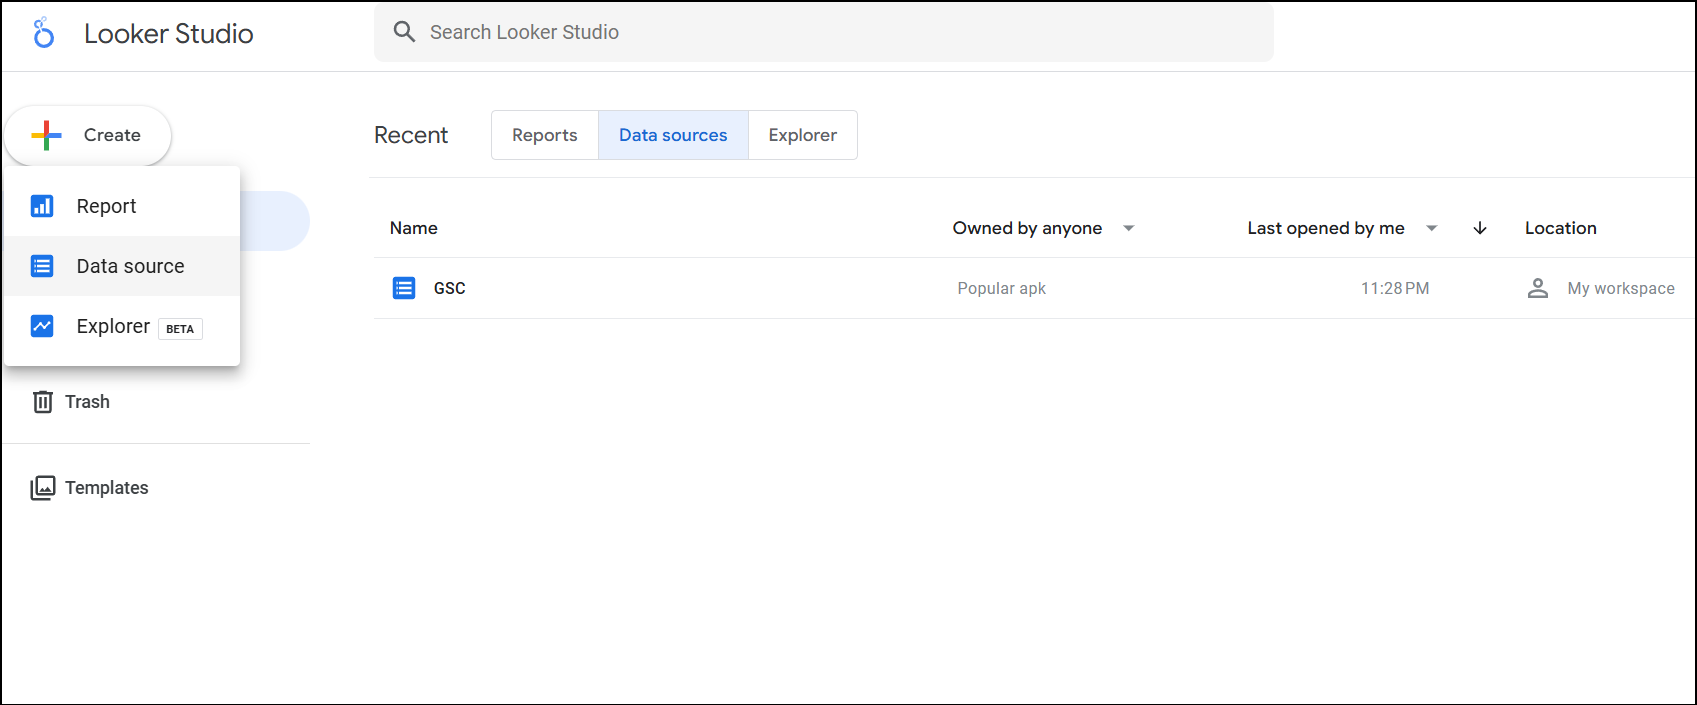
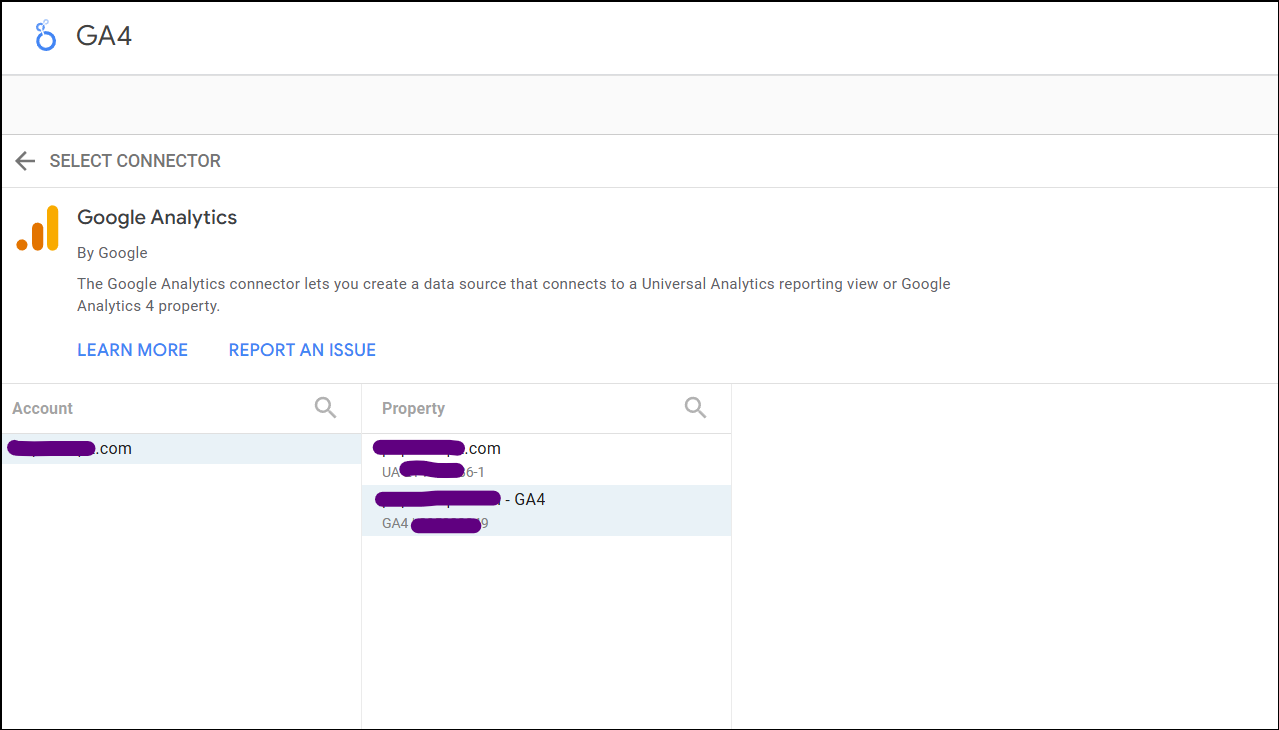
Instead, select “Create” and “Data source” and then select Google Analytics from the list of Google connectors.
After selecting Google Analytics, you’ll see the same GA4 property you have access to. If you have a GA3 property attached, you’ll see that as well. Select the relevant GA4 property and click on “Connect.”
Understanding GA4 and GSC data in Looker studio
Now that we have connected our data sources, we need to blend them. To do this, you need to understand how data sources work.
Each data source has a field and type of data. These fields are further divided into dimensions and metrics. For example, dimensions can be landing page (text-type data), and metrics can be landing page clicks—URL impressions (number-type data).
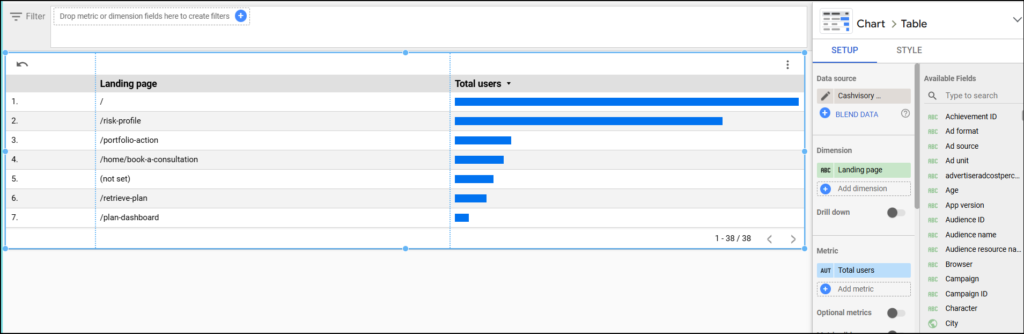
If you explore the GSC data table in Looker Studio, you’ll find that the landing page dimension has full URLs. Example: https://www.example.com/url-slug. See example below:
If you explore the GA4 data table in Looker Studio, you’ll find that the landing page dimension or page path dimension only has the page path, i.e…. the /URL-slug instead of the full URL with HTTPS, domains, or subdomains.
Now, this is a problem since if you want to merge the two data sets, you need a common dimension (or field) to match them.
Ie. It should either be only /url-slug in both GSC and GA4 data or should it only be https://www.example.com/url-slug in both.
There is a solution to this: Custom fields in data. Fortunately, Looker Studio allows us to use formulas to create custom fields. To regularise it, we’ll create our dimension in each of the tables (GA4 and GSC).
From GSC, rather than having the full URL, we’ll extract the URL slug from every URL in the GSC dataset and use it as the common dimension.
Note: As Jannette pointed out in the comments, make the GSC landing page match the GA4 landing page format (no domain, no trailing slash), and then your session-scoped metrics will work.
For GA4, since we already have page paths as a dimension, we don’t alter a lot there. But we’ll still create a new field in our GA4 dataset. Along with the field, there is a field ID (Key ID). To make it work, we need to create identical field IDs in both the GA4 and GSC datasets.
Create custom-calculated fields in Looker Studio
Create a custom field in your GSC dataset
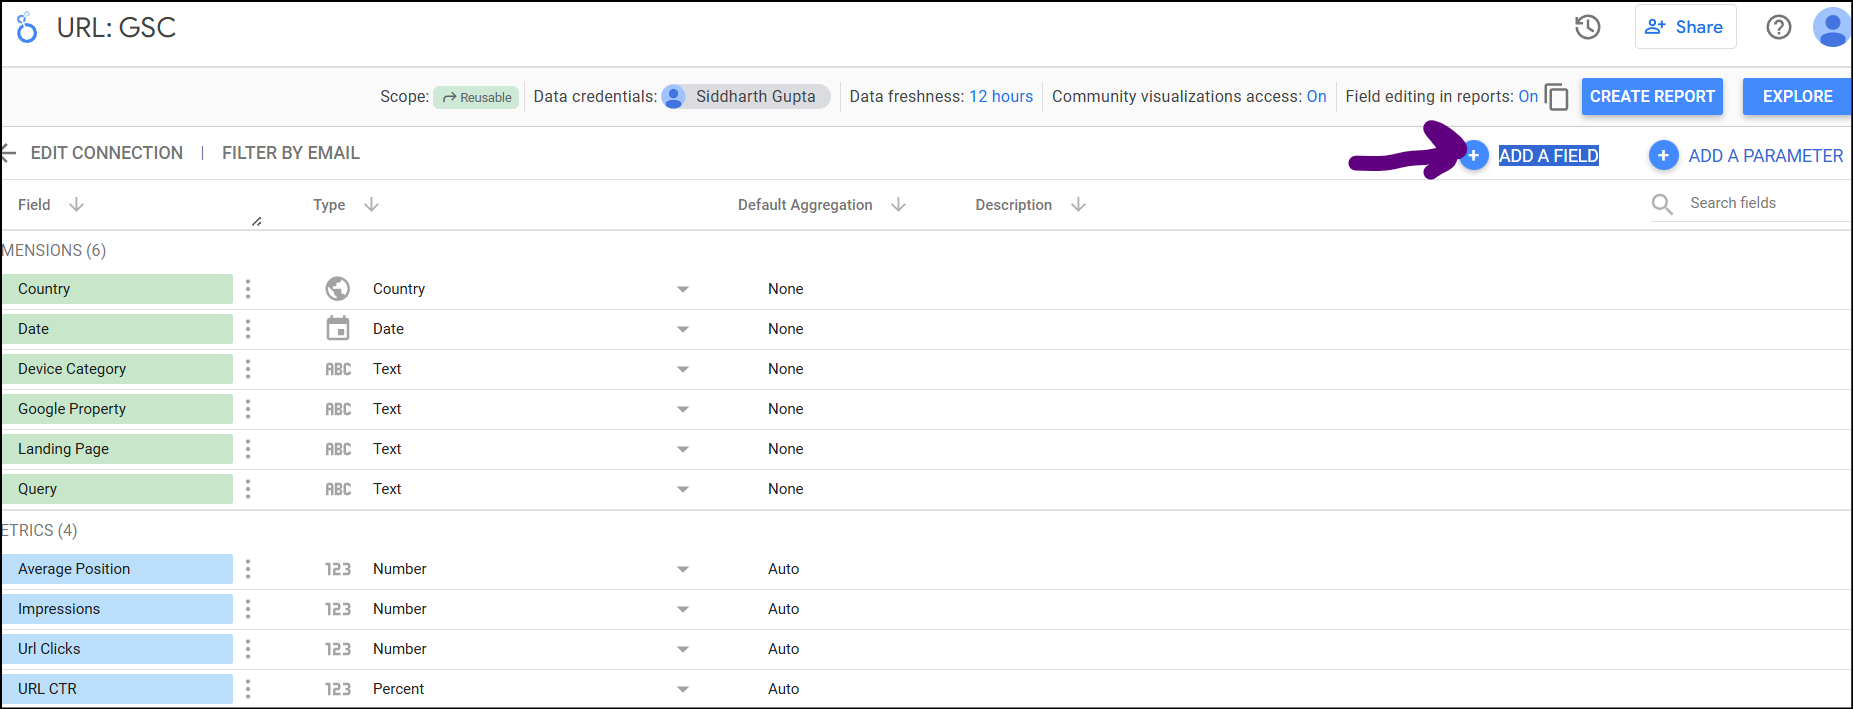
Go to data sources to create a custom field in your GSC dataset. From data sources, double-click on your GSC data source. You will see the fields available in your dataset and the field type.
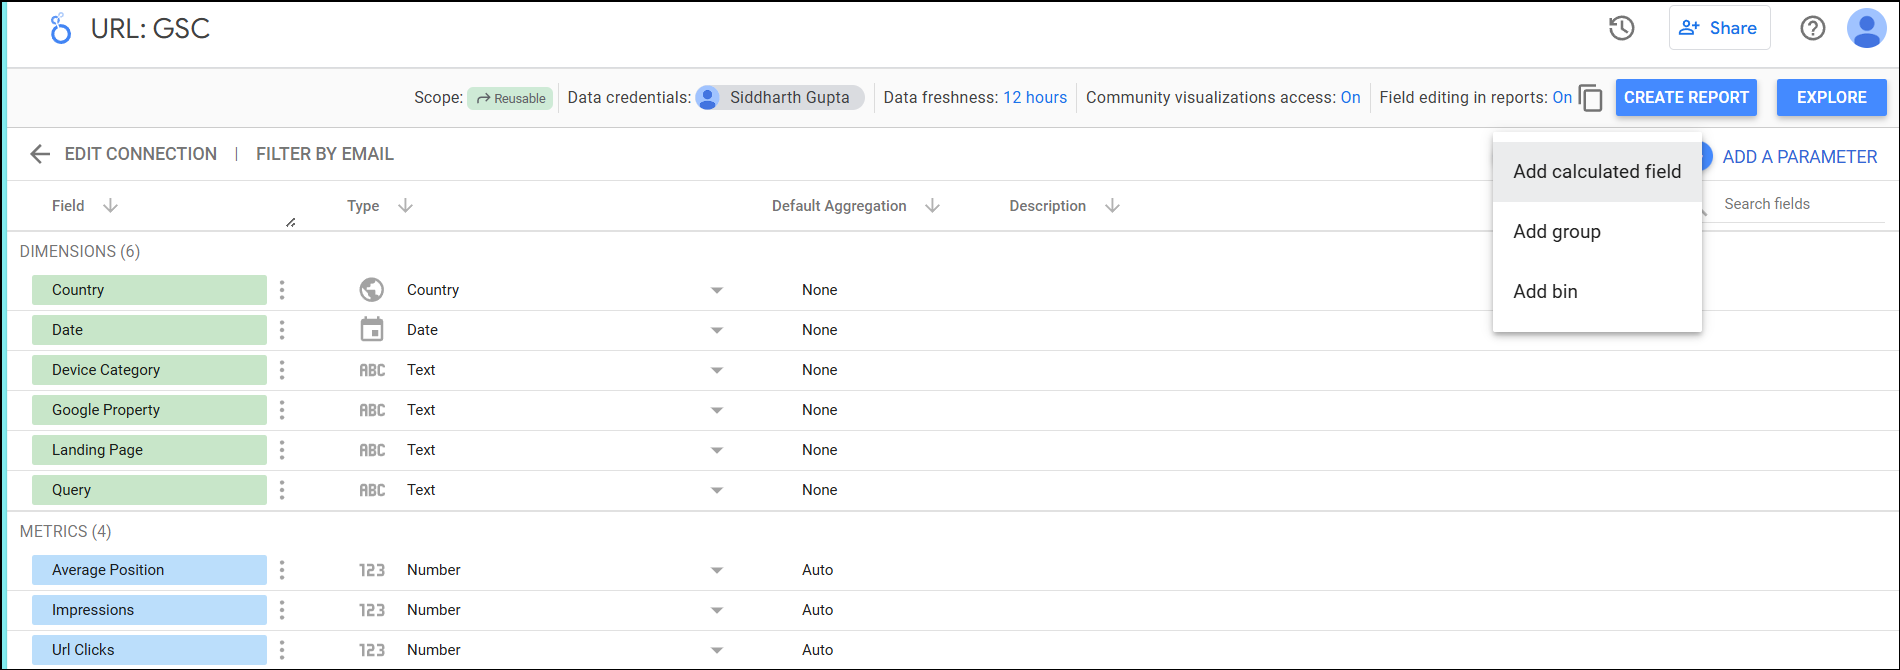
Go to “Add a field” from your dataset and then select “Add calculated field.”
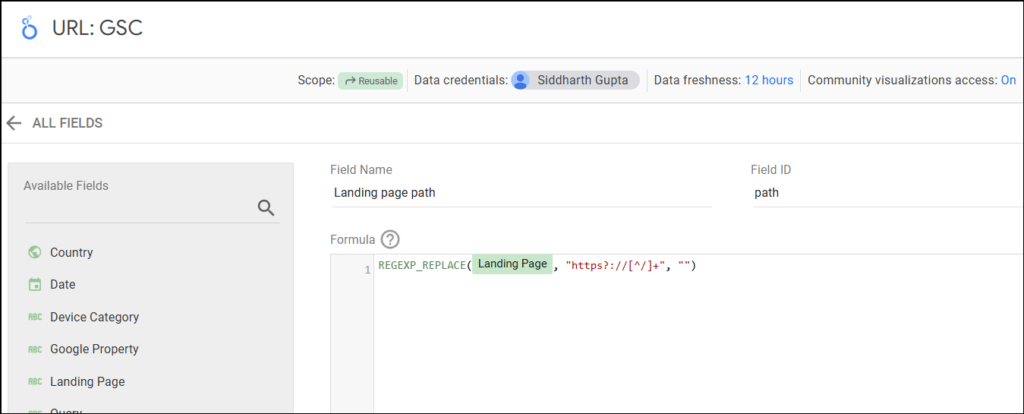
After hitting add calculated field, you can define your field by giving it a name, ID, and formula.
Name This field as “Landing page path” and set the field ID as “path.”
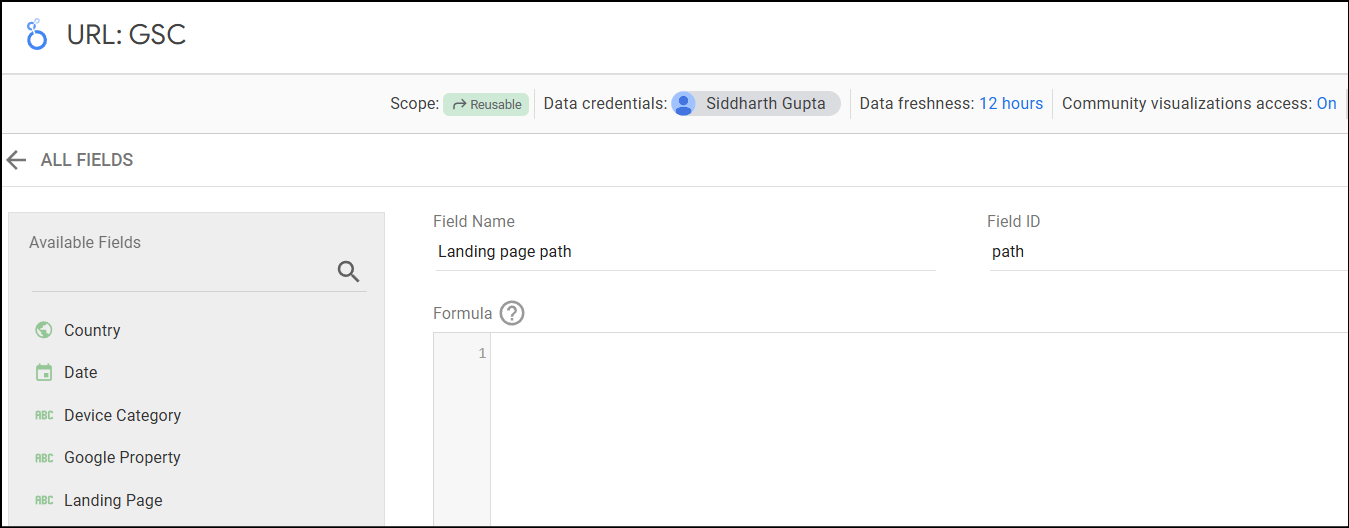
We know that we want to use this as a dimension. We want to use the “Landing page” as the existing dimension from this dataset and replace it with the URL slug from it.
For this purpose, we’ll use the “Regex_replace()” formula to input the landing page and replace it with the page path from that landing page.
REGEXP_REPLACE(Landing Page, "https?://[^/]+", "")
Your field details should look like this:
After you’re done, hit on save.
Create a custom field in your GA4 dataset
Do similar steps to create a custom field in your GA4 dataset in Looker Studio.
Go to “add a field,” go to “Add calculated field,” and name your field name as “Landing page path” and field ID “path.”
For the formula here, since we already have a page path dimension, we can use that.
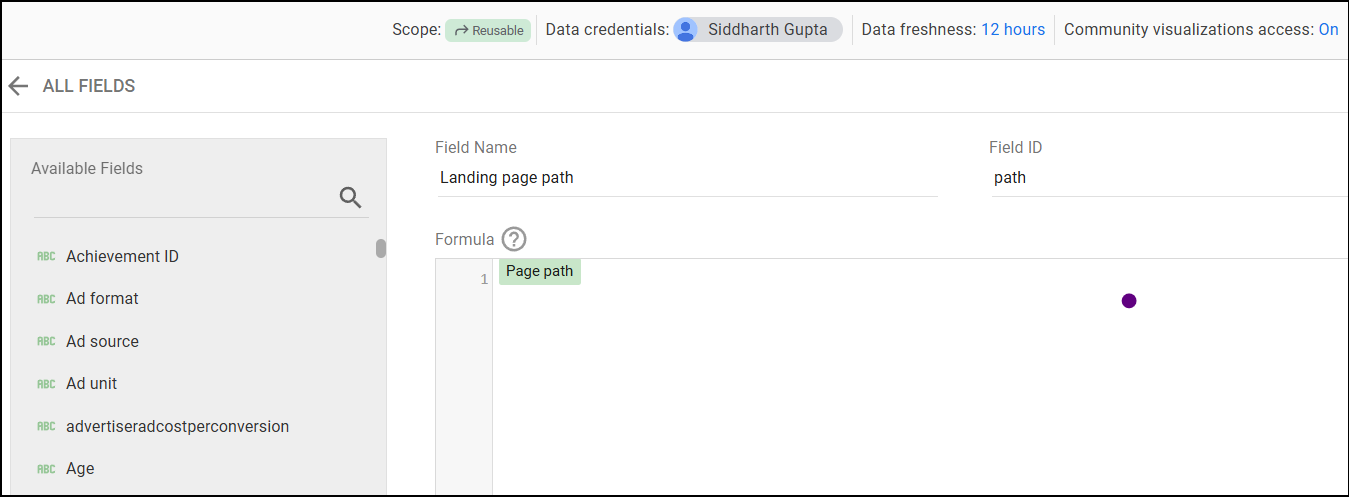
Hit save, and you’re ready to merge GA4 and GSC data!
Creating Looker Studio report with Merged GA4 & GSC data
Blending GA4 and GSC data in Looker Studio
Create a blank report in Looker Studio and use your existing data sources (GA4 and GSC).
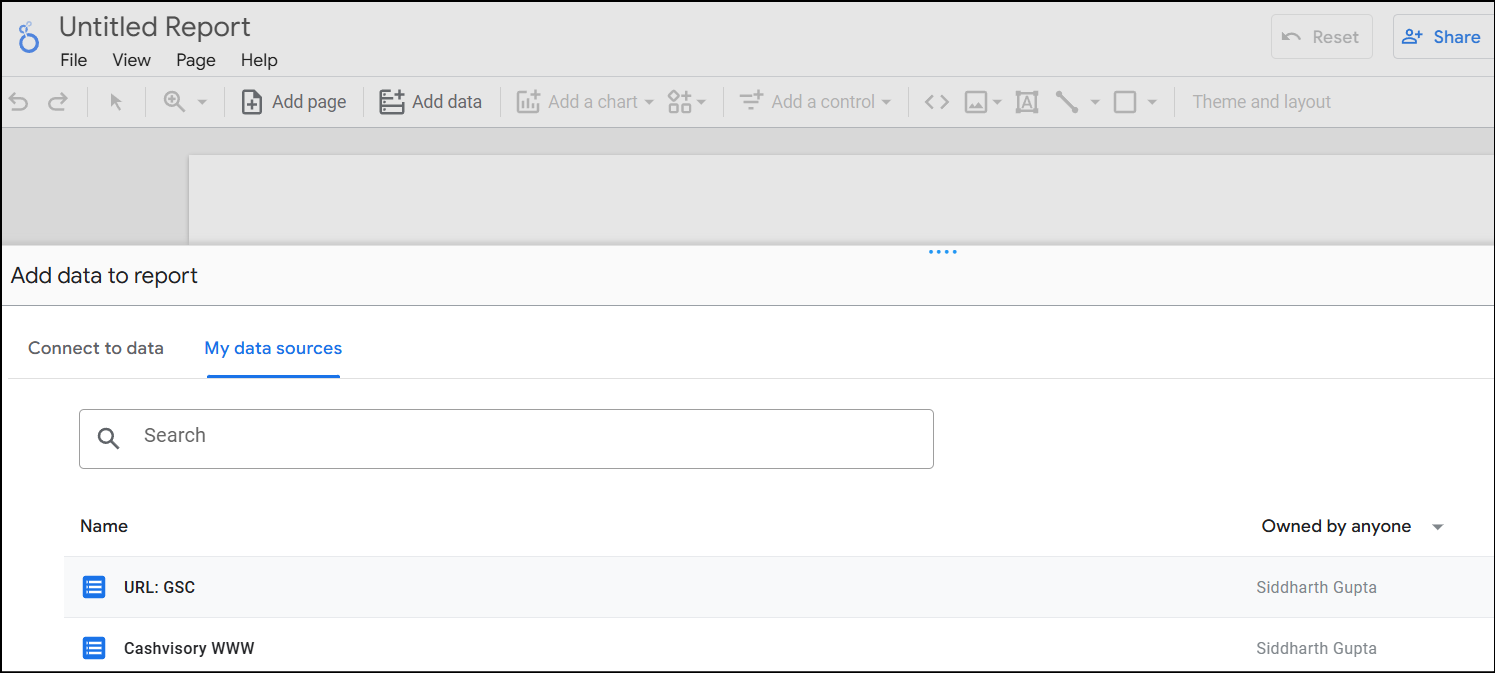
After you’ve added GA4 and GSC as data sources in your report, you’ll see the calculated field (Landing page path) you created earlier in both sources.
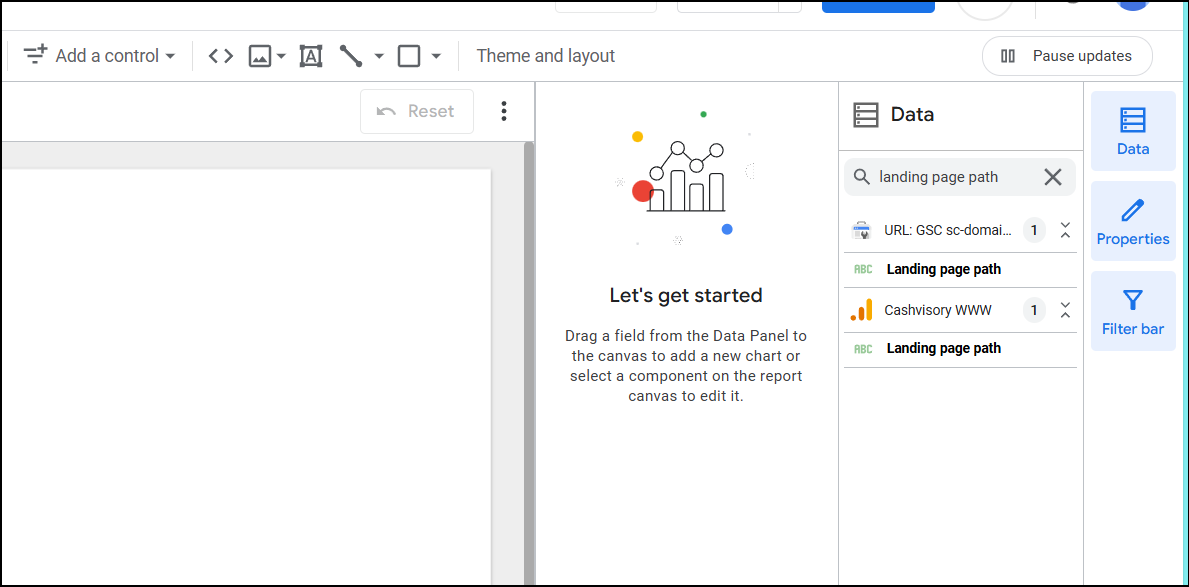
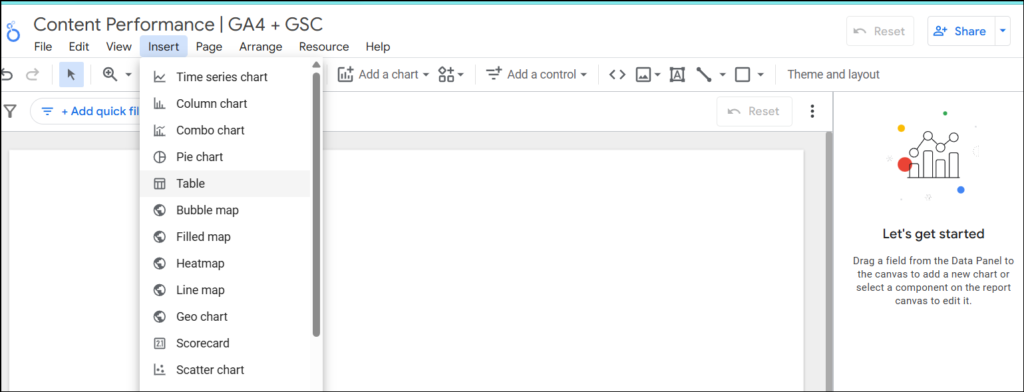
To blend the data, insert a table in your report. The data sources will be visible in the right sidebar. From there, select “Blend data.”
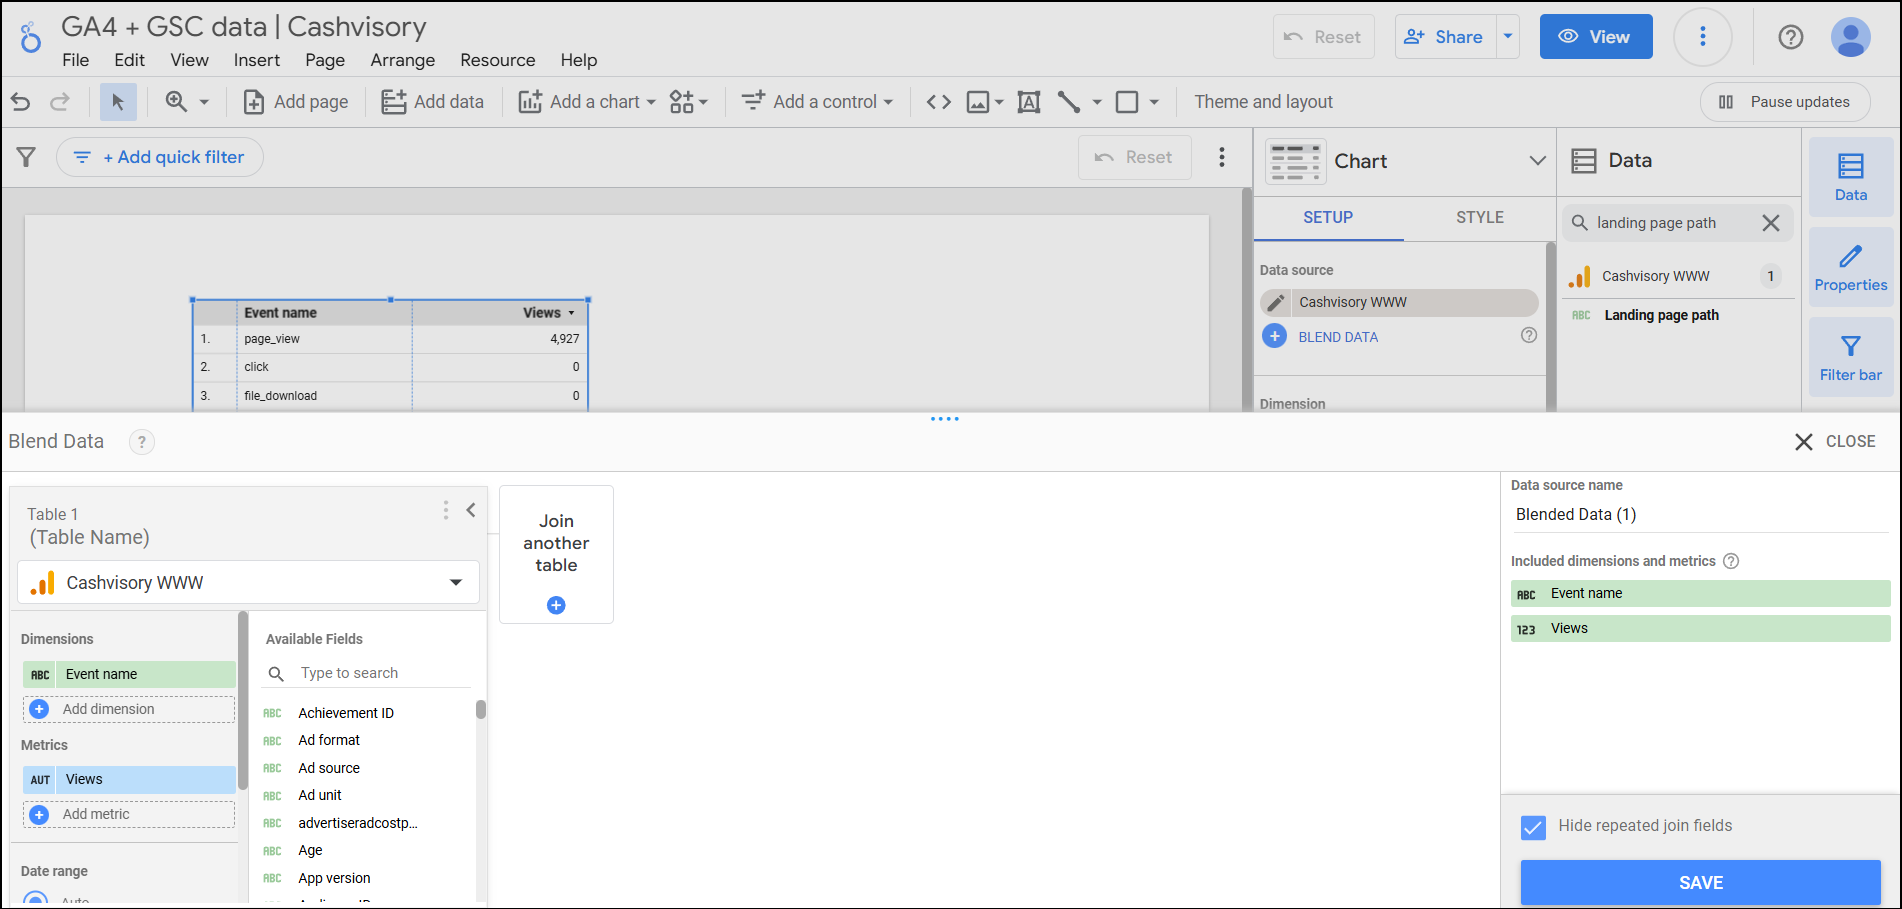
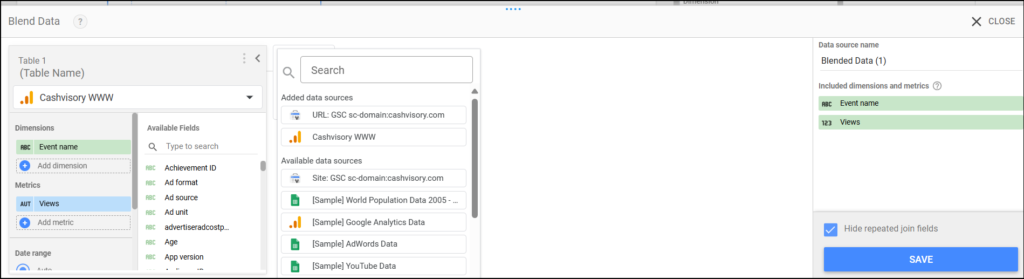
After you’ve hit “Blend data”, you’ll see an existing table on the left. You’ll see an option to join another table on the right. Select “Join another table” and select the data sources not on the left table from the list that appears. (GSC data in my case here)
Now that you’ve both of your tables containing your GA4 and GSC datasets, it should look like this:
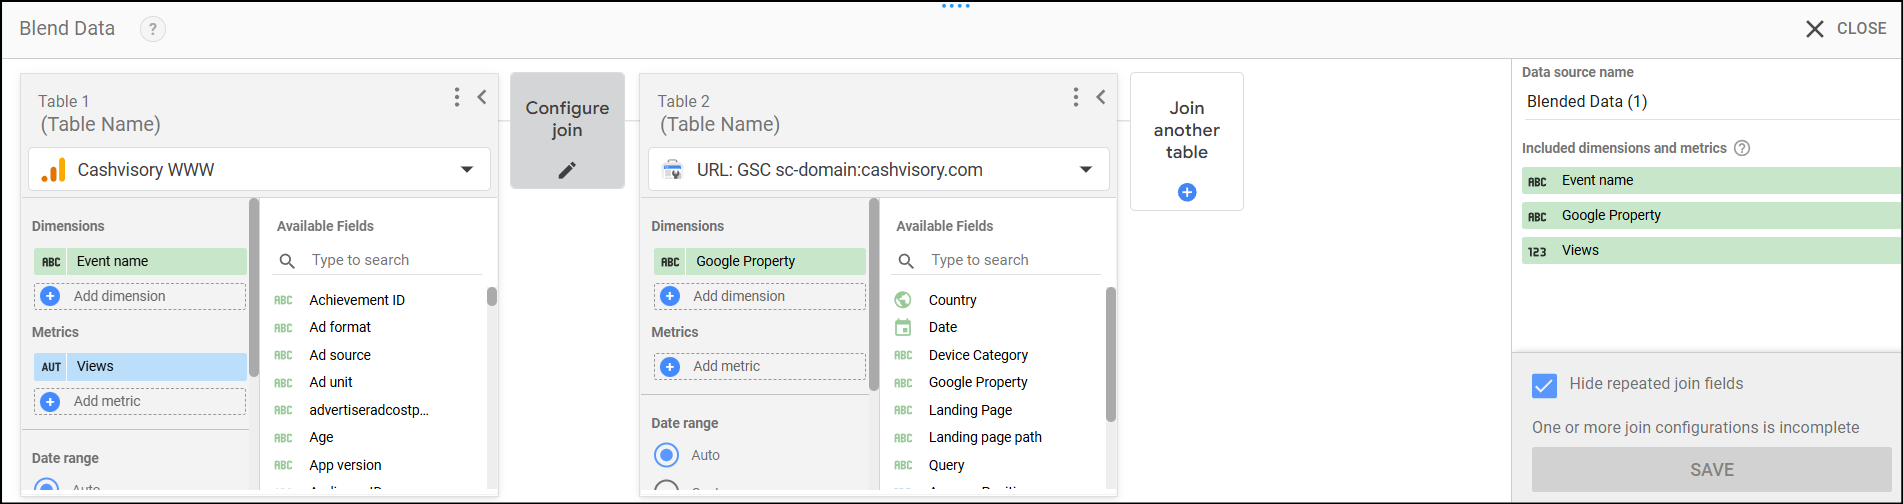
But before configuring join, we must also select the metrics and dimensions we’ll need for this dataset.
Looker Studio doesn’t take the whole dataset by default. It will only use the metrics and dimensions we select in each table.
Now, we know that we want to analyze content performance. For analyzing content performance, you’ll need these metrics and dimensions:
GA4:
- Dimension – Landing page path
- Dimension – Session source
- Dimension – First user source/medium
- Dimension – Device category
- Metric – Total users
- Metric – Bounce rate
- Metric – Events per session
- Metric – Average session duration
GSC:
- Dimension – Landing page path
- Dimension – Query
- Metrics – Url Clicks
- Metric – Impressions
- Metric- Url CTR
- Metric – Avg Position
After selecting your dimensions and metrics, you can verify these fields on the right-hand side of the screen.
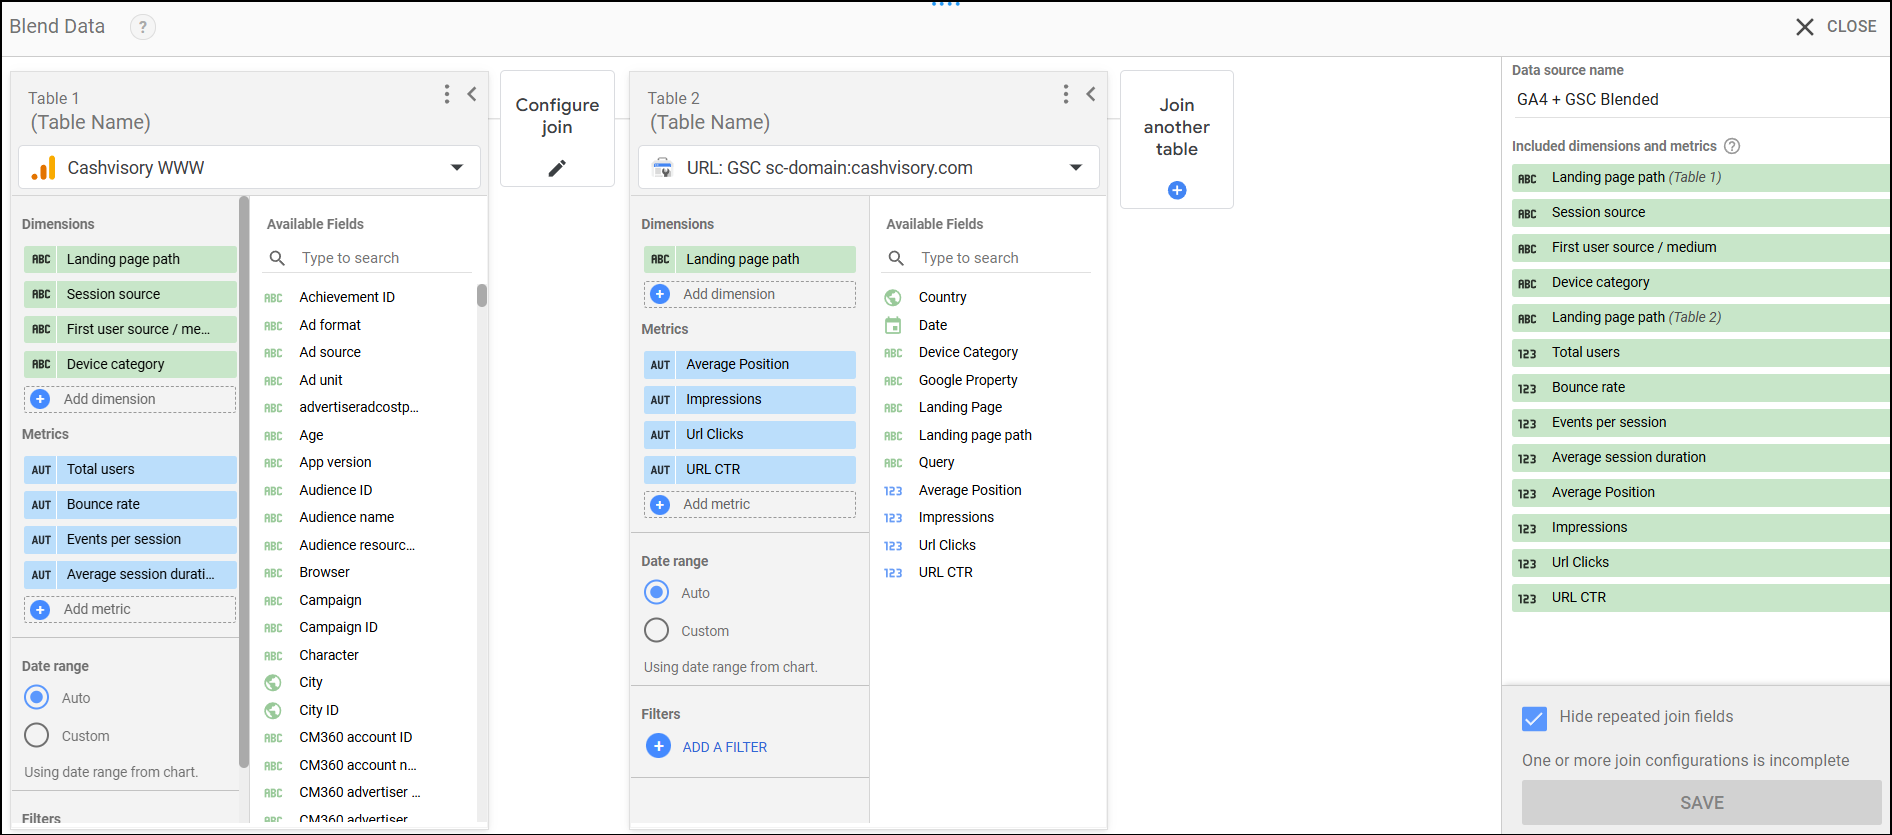
we need to configure the join conditions to match the custom calculated fields that we created earlier.
For it, select Configure Join.
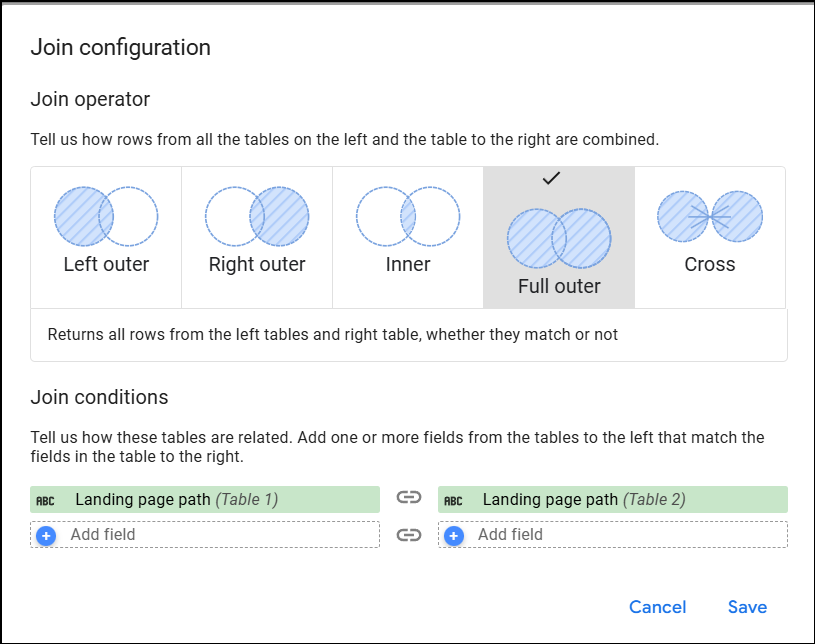
After you select configure join, you’ll see a few options for the join operator. These are pretty self-explanatory. To examine all our pages, whether in GSC or from GA4, I suggest that you use the “Full outer” Join.
You must tell Looker Studio how these two tables are connected in the Join conditions. We know that in both tables (GA4 and GSC), we have a common field with a standard field ID (Landing page path with field ID as ‘path’).
We can let Looker Studio know that it can use those fields to join the two tables, thereby joining all other data related to them.
After you have configured your table joins, click on save, and you’ll be taken back to your report. You’ll see your blended data in the data source under the setup tab.
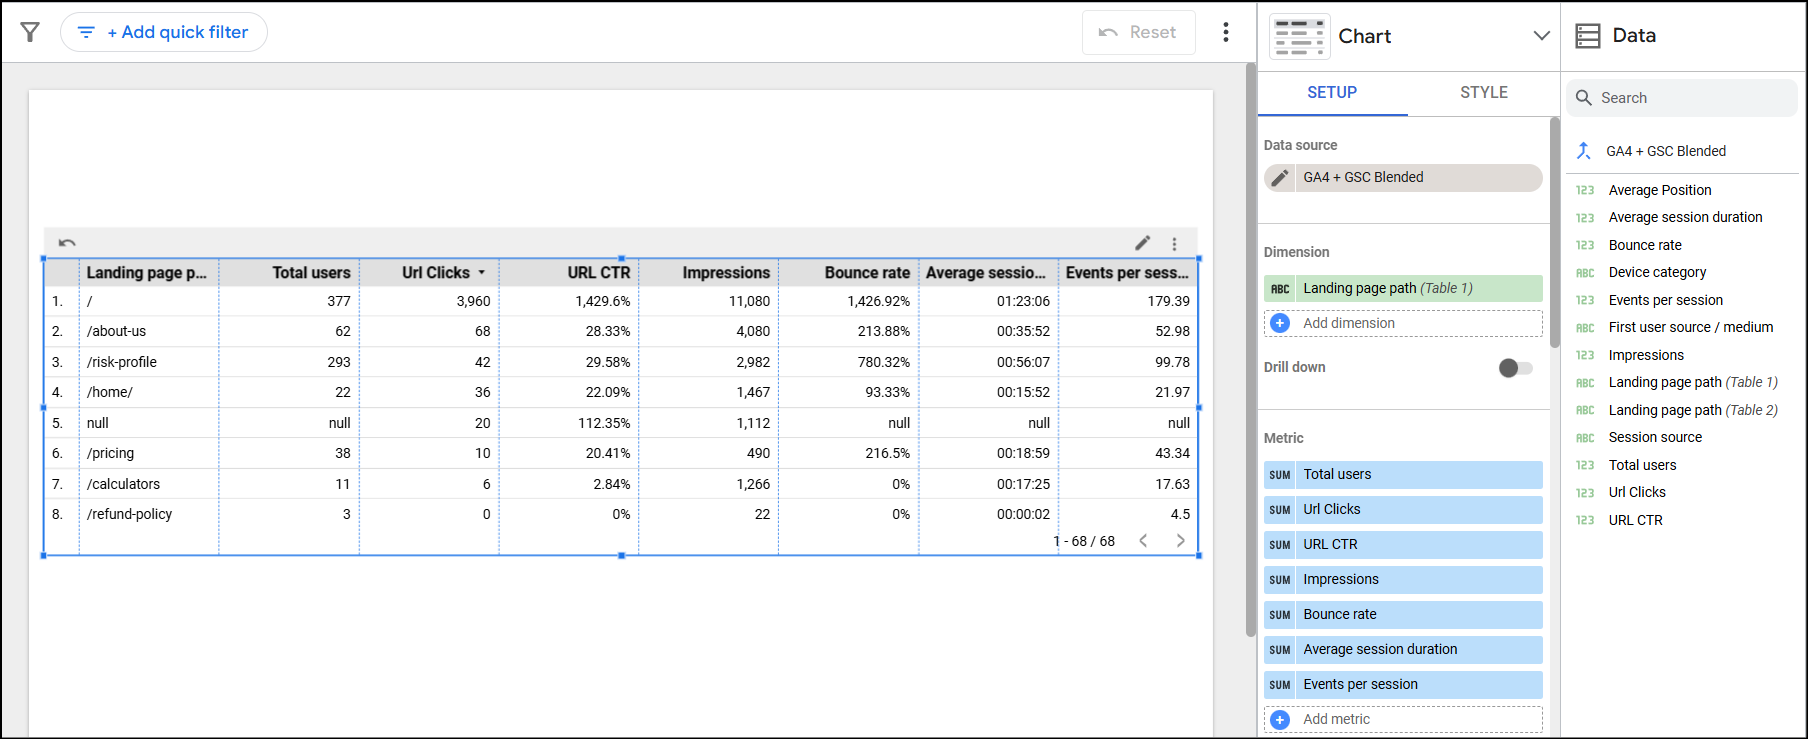
Congratulations on reaching this point. You’ve successfully blended GA4 and GSC data in Looker Studio. Now, you only need to set up the table and possibly create a dashboard to analyze content performance.
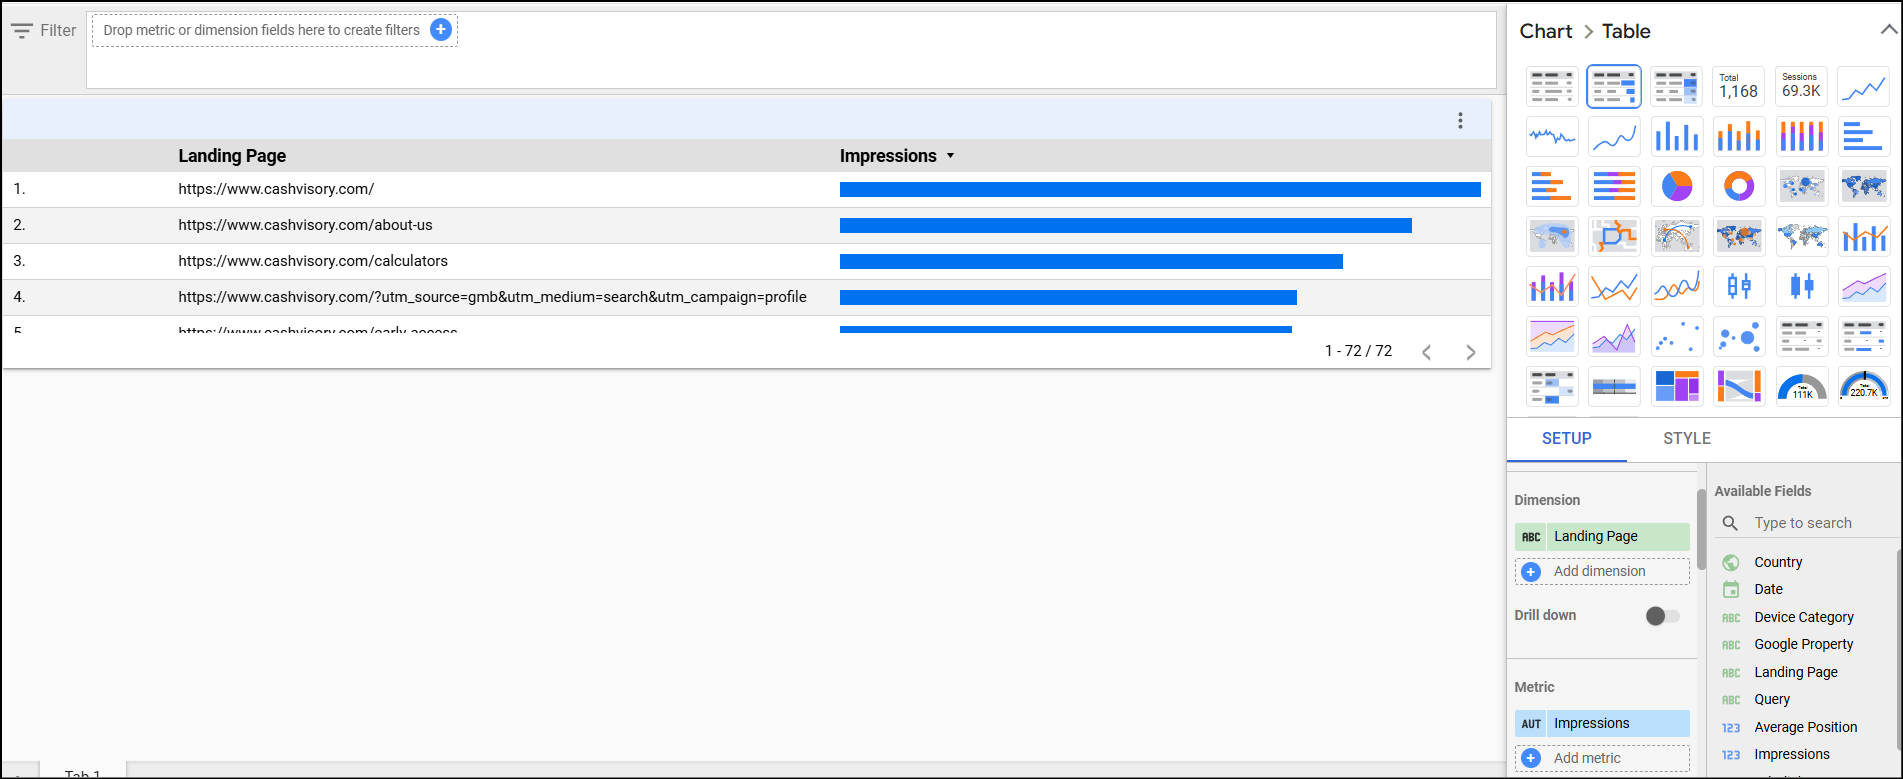
In your table, select the dimension as the Landing page path and the metrics you need to analyze content performance.
Analyse data, Derive insights, and Improve your content performance
Stay tuned for this section.
I’ll show how to create a dashboard that will help you analyze this merged data to analyze content performance and derive insights.
Connect with me on Linkedin to get this template sooner rather than later! (and for free, of course!)
Noted issues
- The landing page is not a reliable dimension. There are “not set” values or “Null” values.
- The list will depend on your joining conditions. Full join would mean you might have pages with only GSC and no GA4 data. You would also have pages with only GA4 data but not GSC data. This ensures you’re not missing out on pages that might be important for your business.
- The Regex Formula used to standardize page paths doesn’t make normalized URLs with subdirectories. For example, https://www.domain.com/blog/url-slug will change to blog/URL in the search console dataset, which will not match the page path of url-slug in Google Analytics.
Learnings
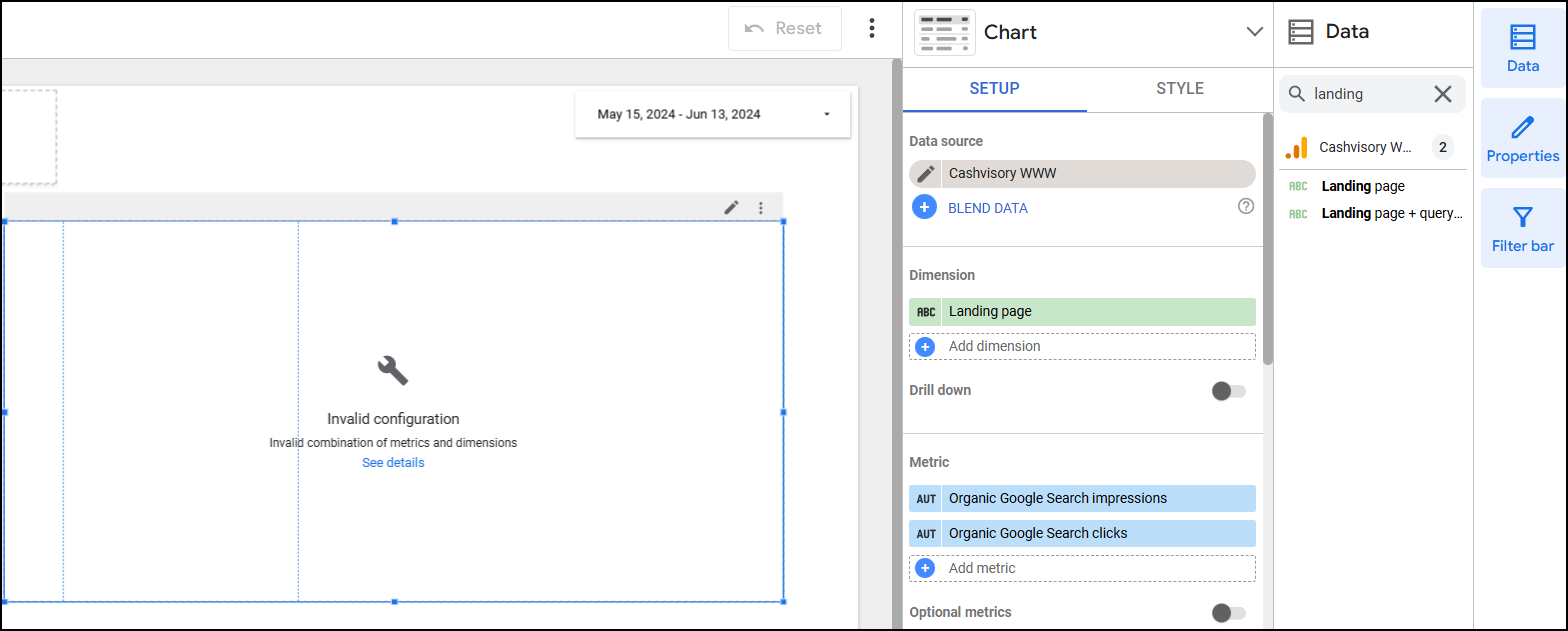
- If you’ve connected your Google search console to your Google Analytics 4 account, you’d think your GA4 dataset should already have those GSC metrics. I’ve tried to use dimensions from GA4 (Landing pages) and metrics such as Organic Google Search impressions and organic Google Search clicks together. But sadly, it doesn’t work in Looker Studio.
- You need to know the difference between a metric and dimensions. If you put, for example, Device (which is a dimension) as a metric, you’ll see numbers instead of characters (desktop or web) when you put the device as control and filter your results. This is true for other dimensions, such as landing pages, page paths, etc.
Inquisitive?
Read this Medium article to learn how to blend GA4 and Universal analytics data.
Learn how to filter organic traffic in Looker Studio using only your GA4 data.


Siddharth – this read was such a practical time-saver. Thank you!
SO GLAD that it helped you Komayal!
How does this work without requiring the Date dimension? What if I want various date ranges?
Also, I tried your example, but aggregated metrics, like average session duration, give impossibly large values, did you change those metrics to be aggregated by “Average”? (even when I do that, the still seem high for most of my pages). Also, I can’t seem to get this to work with basic metrics such as sessions and keyevents:conversionname, and I can use session source or session medium, but not session source / medium. Can you explain what types of dimensions and metrics won’t work in blended data sets?
Thanks!
I figured out how to get sessions to work. I had to make the GSC landing page match the GA4 landing page format (no domain, no trailing slash), then the session-scoped metrics worked. But my question about the date still remains. Thanks!
Hi Jannette – That’s right – we have to match the GSC landing pages (I’ll highlight this in the article to help others fastrack their reports).
Your question about dates: Since the date dimension is already passed from GA4 and GSC (from the source), you do not need to worry about it. If you want more control over your data to see changes wrt to dates, you can add it as a control function in your report and your data will be sliced according to your selection there. Hope this helps – Cheers!