If you’ve set up GA4 e-commerce tracking on your website, you would have received that data in Google Analytics. While GA4 reports are a good starting point, you might need something solid to measure your e-commerce store performance.
In this post, we’ll see:
- How to connect Google Analytics to Looker Studio
- Import GA4 e-commerce data to Looker Studio
- Create a WooCommerce shop performance dashboard with topline stats.
The Looker Studio Dashboard
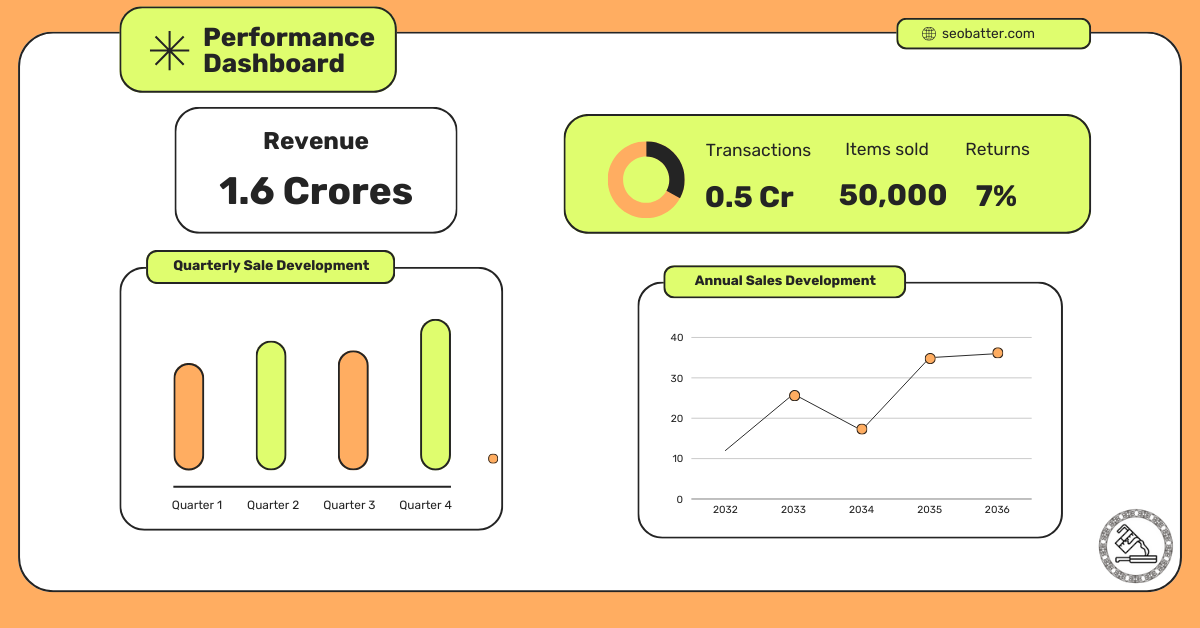
So here is a simple dashboard that shows revenue and product data. The first page shows revenue metrics, giving stakeholders an overview of how sales impact the business’s bottom line.
The next page is more into products and product categories, which made more sense than other metrics because the business outsources products in a few categories.
Note: For simplicity, this is a derived dashboard from the original one I created for DD Farms. We’ll use this one to explain the setup.
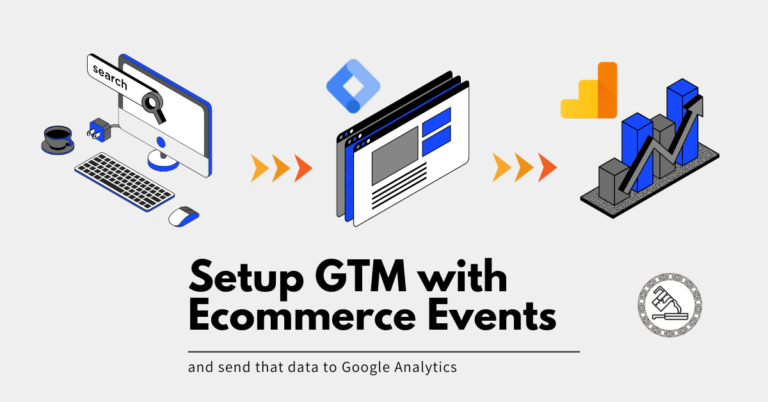
The data is sourced from the WordPress + WooCommerce website using Google Tag Manager and Google Analytics.
The actual report has many more pages and more data. It has advanced calculated fields along with other cost data that I have not included to avoid going on a tangent.
Connect Looker Studio with Google Analytics
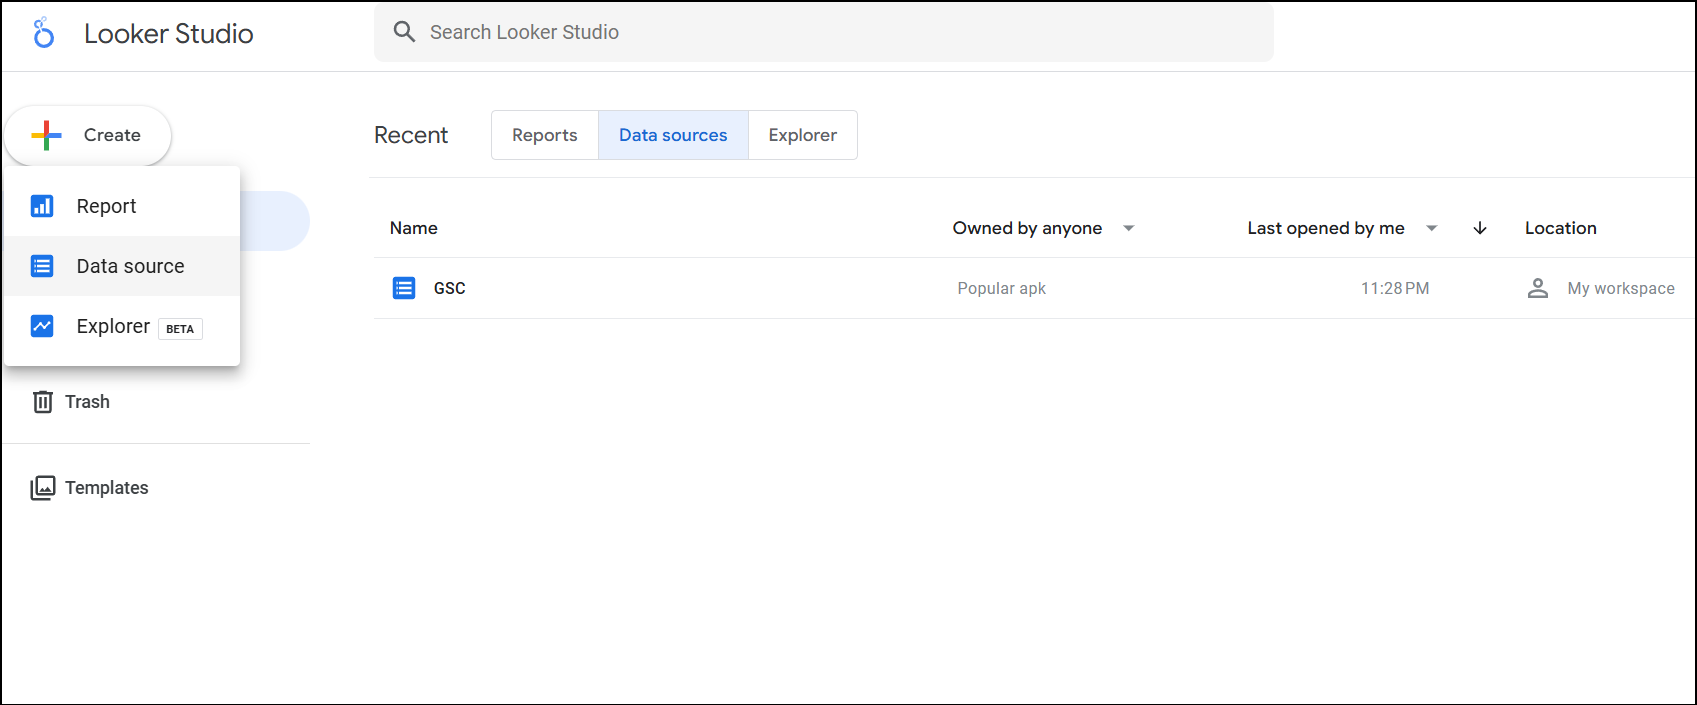
To connect GA4 data to Looker Studio, go to the “data sources” tab. Select “Create” and select “Data source” there
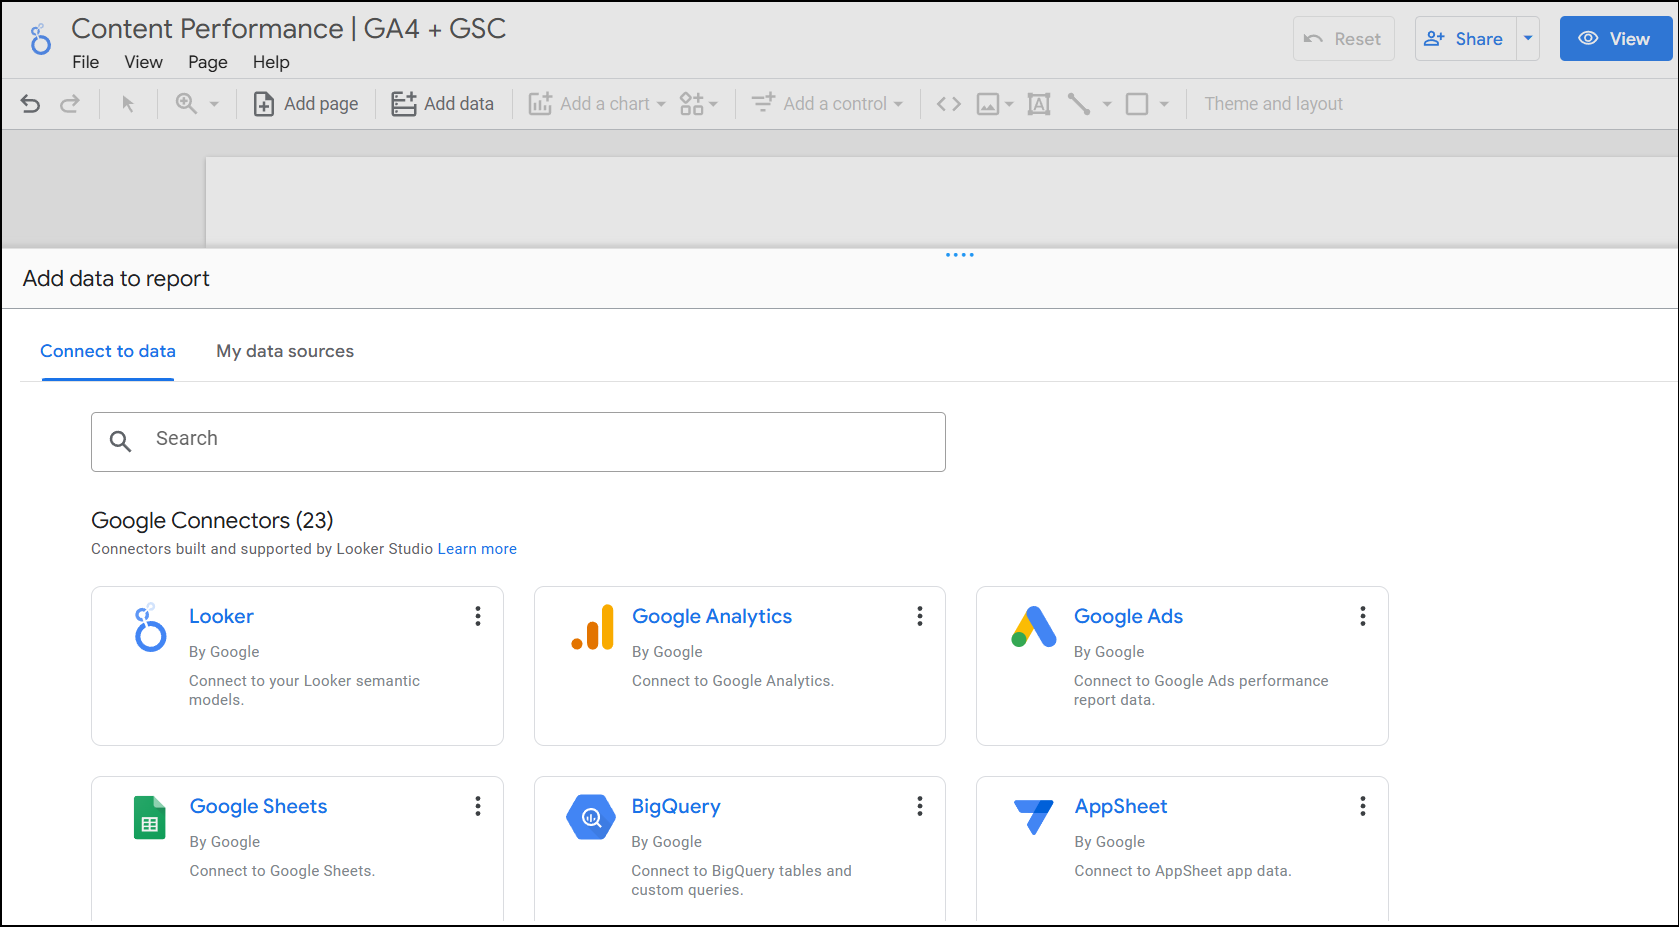
Select Google Analytics from the list of Google connectors.
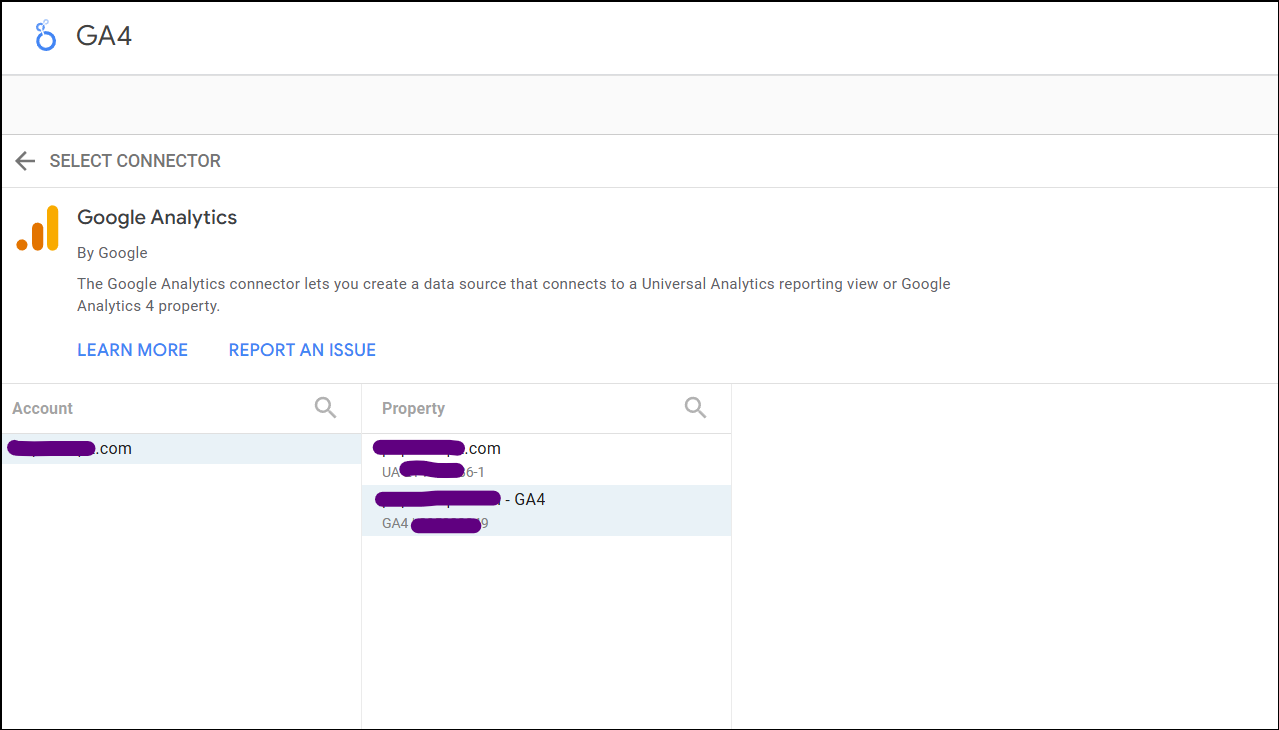
After selecting Google Analytics, you’ll see the same GA4 property you have access to. If you have a GA3 property attached, you’ll see that as well. Select the GA4 property and click on “Connect”.
That’s it, you’ve connected Google Analytics to Looker Studio
Import GA4 eCommerce Data to Looker Studio Report
Click on Create, Report.
Your new report will ask you for the data source. You can do it if you still haven’t connected your GA4 property. If you’ve connected your GA4 data to Looker Studio, select the adjacent tab, “My Data Sources.”
From the list, select your WooCommerce GA4 property.
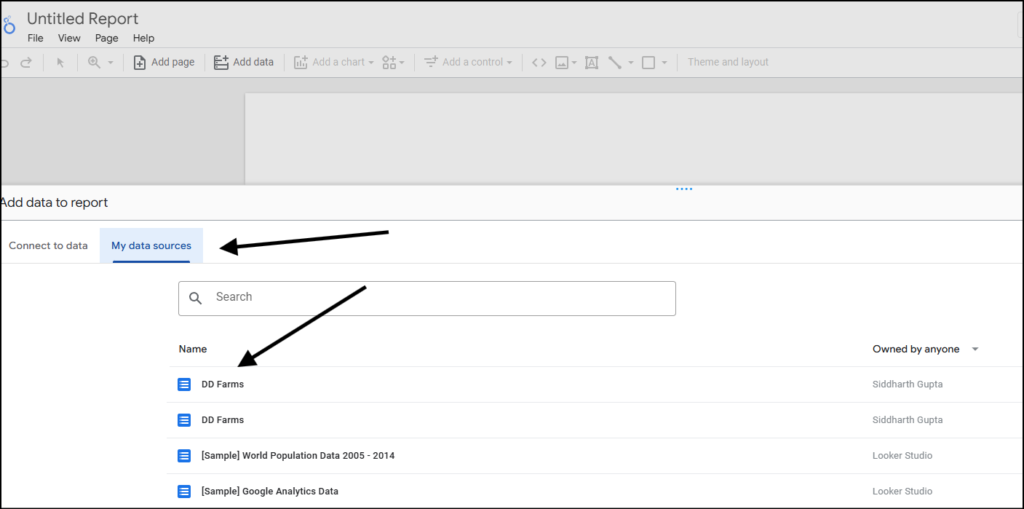
Select add to report if prompted.
A blank report will be created, with a table containing event names.
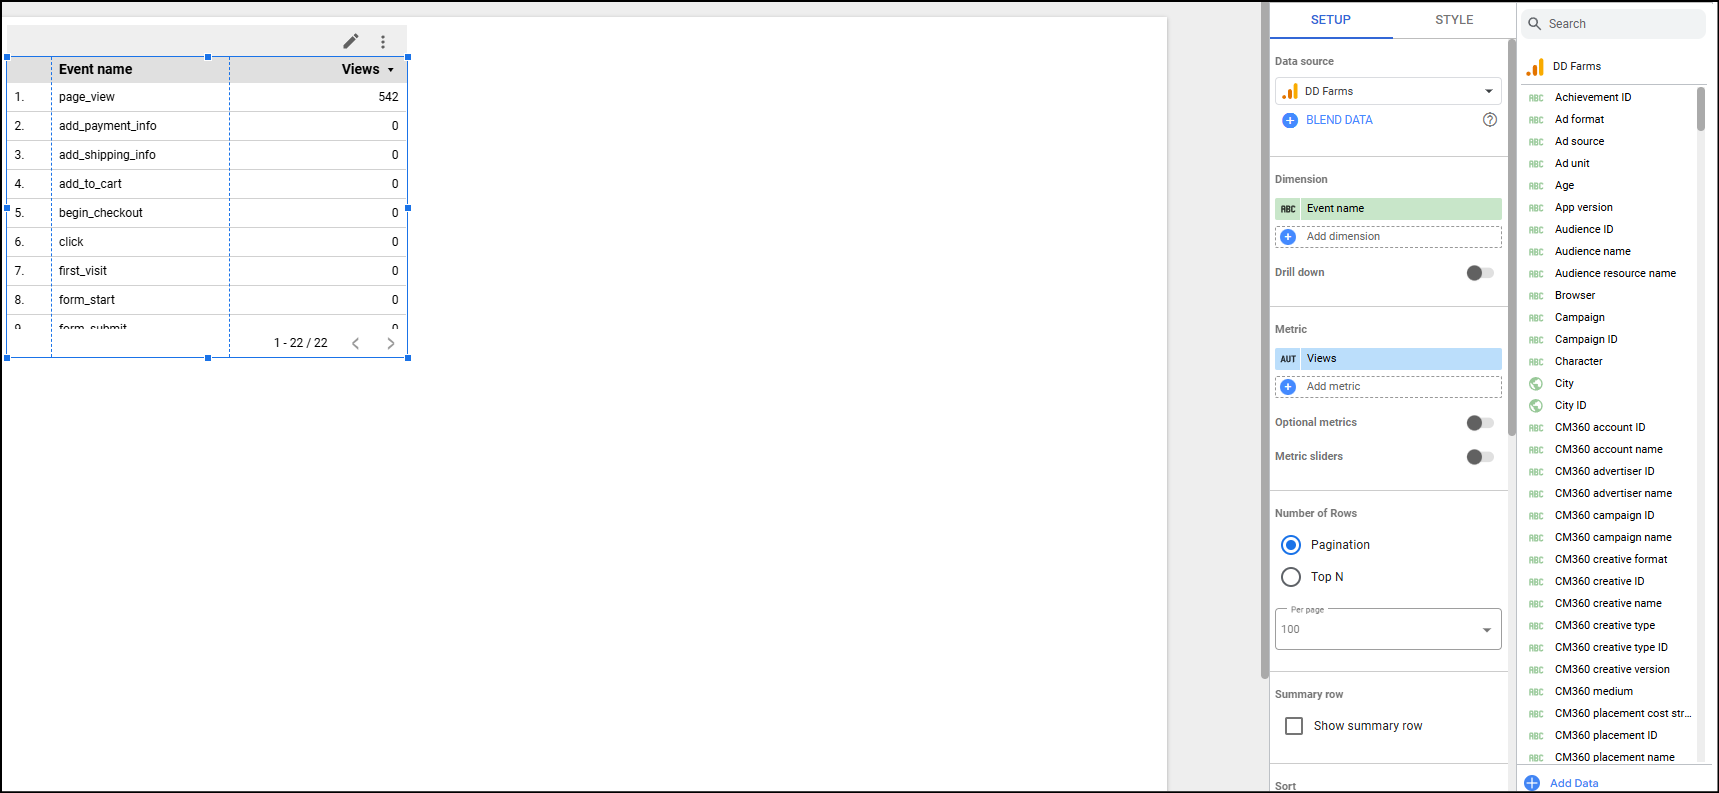
That’s it. You’ve successfully imported all your Google Analytics data into a Looker Studio report.
Creating a Looker Studio Dashboard – Measuring WooCommerce Shop Performance
To create a dashboard like the one above, you just have to use the data you have already imported and visualize it. Visualize the data in a way that would make sense for most stakeholders.
Because this is not a Looker Studio tutorial, I can show some metrics and how to visualize those using Looker Studio.
Metrics & KPIs
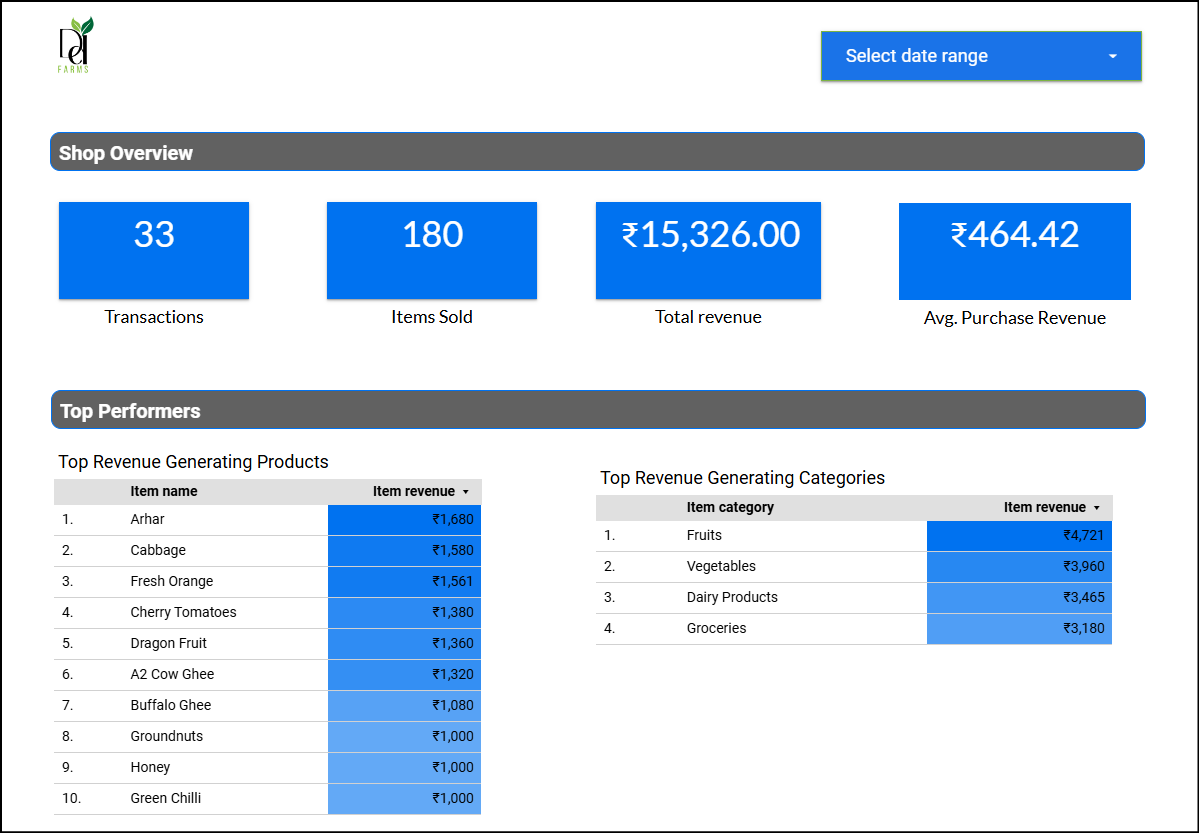
Shop Overview (First Page)
Metrics
Transactions
The scorecard chart has transactions as the metric.
Items sold
The scorecard chart has “Items Purchased” as the metric.
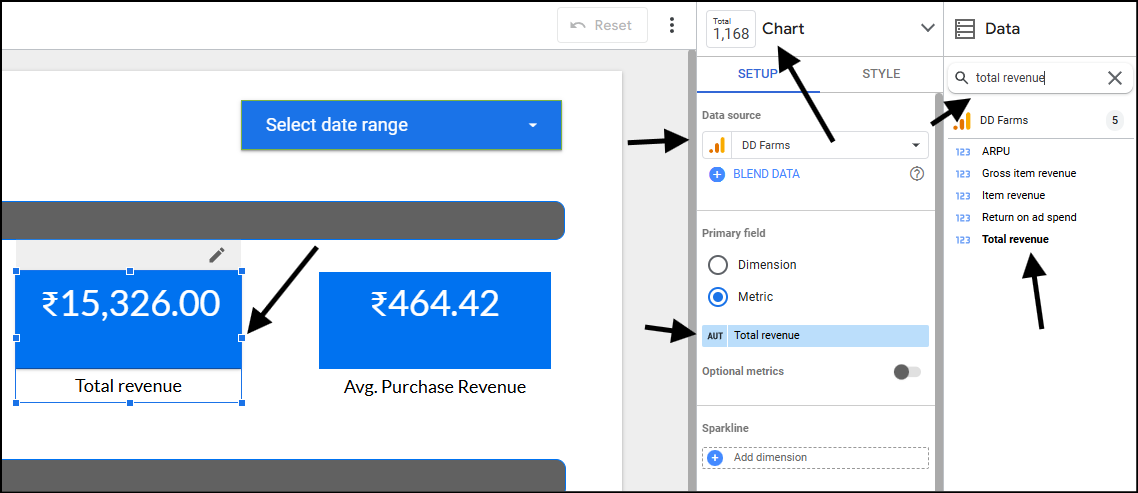
Total Revenue
The scorecard chart has “Total Revenue” as the metric.
Average purchase revenue (or Average order value)
The scorecard chart has “Average Purchase Revenue” as the metric.
Tables
Top revenue-generating products
- Table – Table with heatmap
- Dimension – Item Name
- Metric- Item Revenue
- Sort – Item Revenue, descending
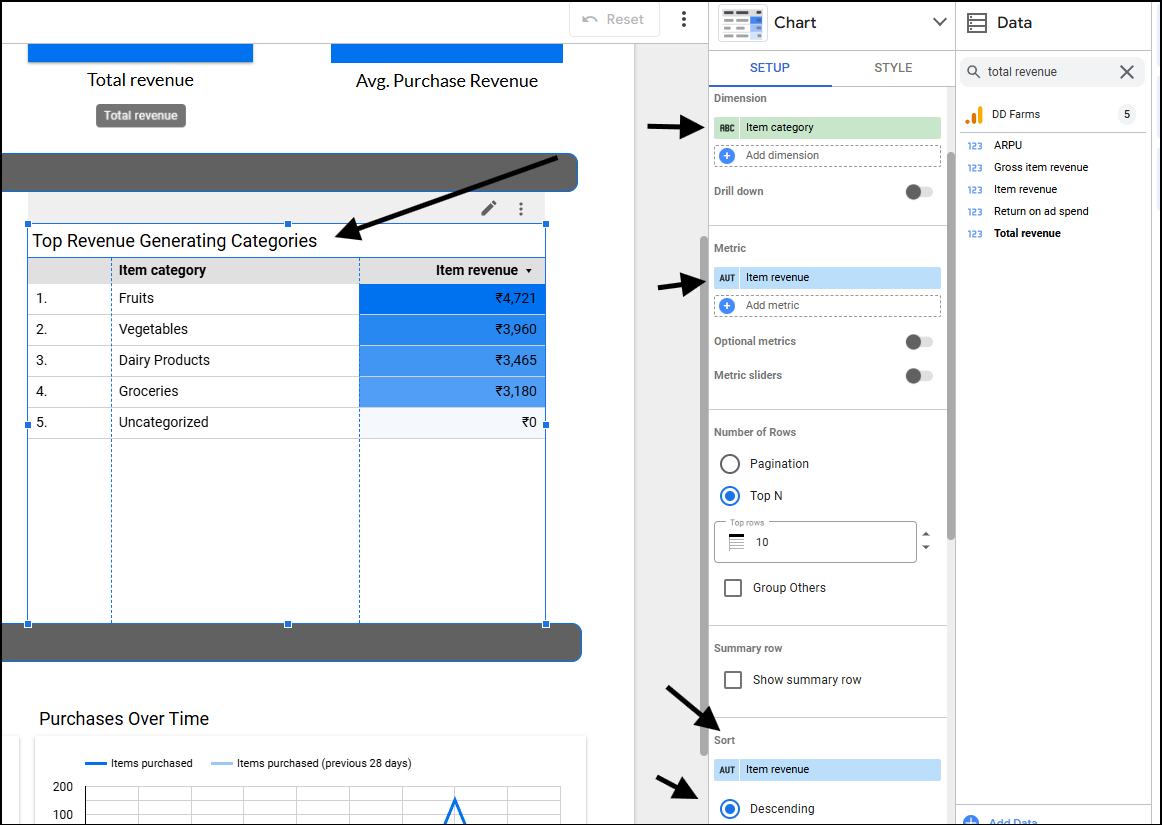
Top revenue-generating categories
- Table – Table with heatmap
- Dimension – Item Category
- Metric- Item Revenue
- Sort – Item Revenue, descending
Charts
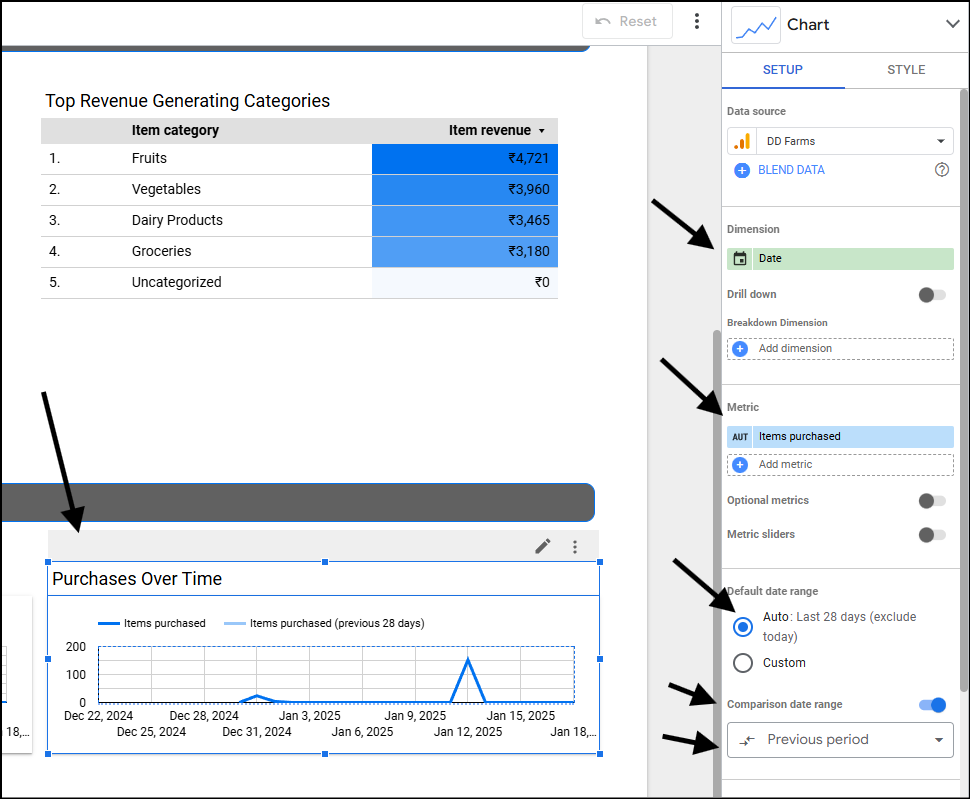
Sales Volume over Time (in INR)
- Chart – Time series chart
- Dimension – Date
- Metric- Total revenue
- Date range – Auto
- Comparison date range on previous period
Purchase over time (In units)
- Chart – Time series chart
- Dimension – Date
- Metric- Items purchased
- Date range – Auto
- Comparison date range on previous period
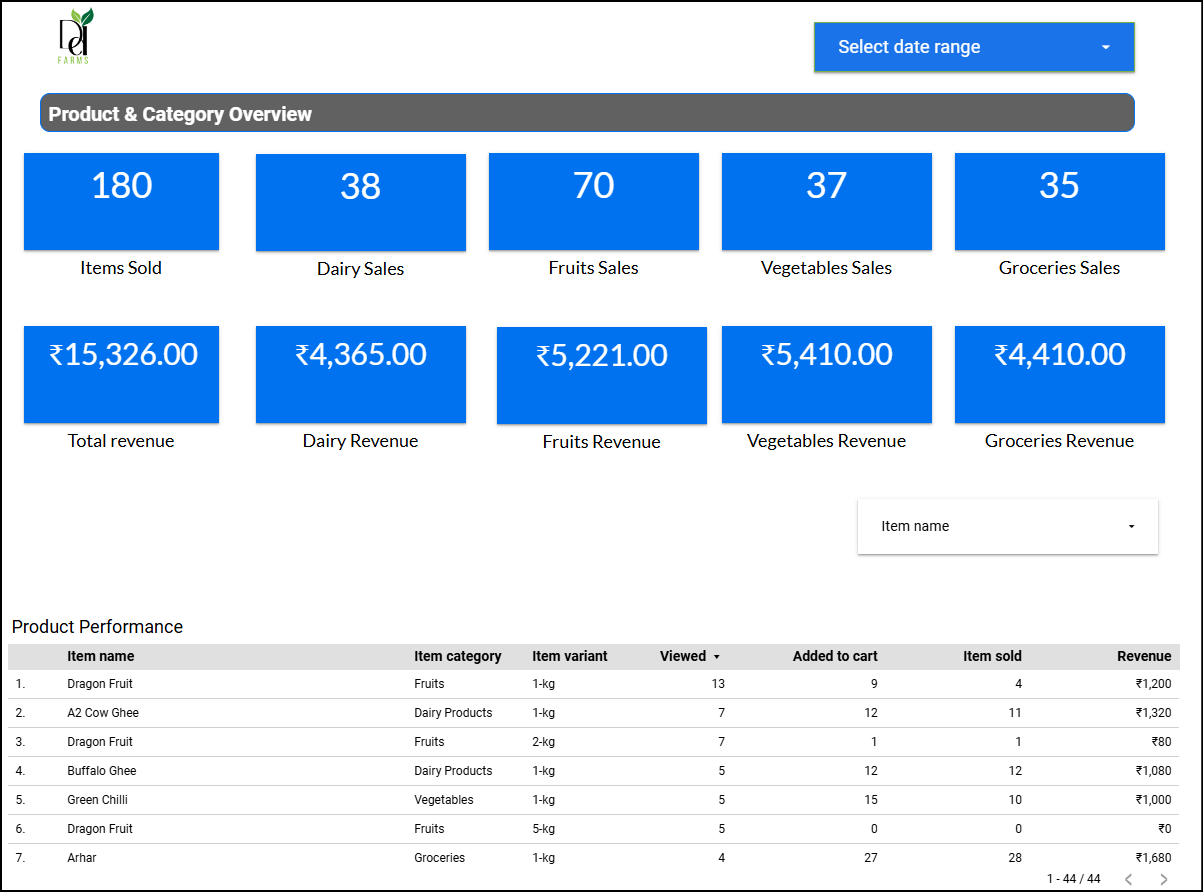
Product and Category Performance (Second Page)
Metrics
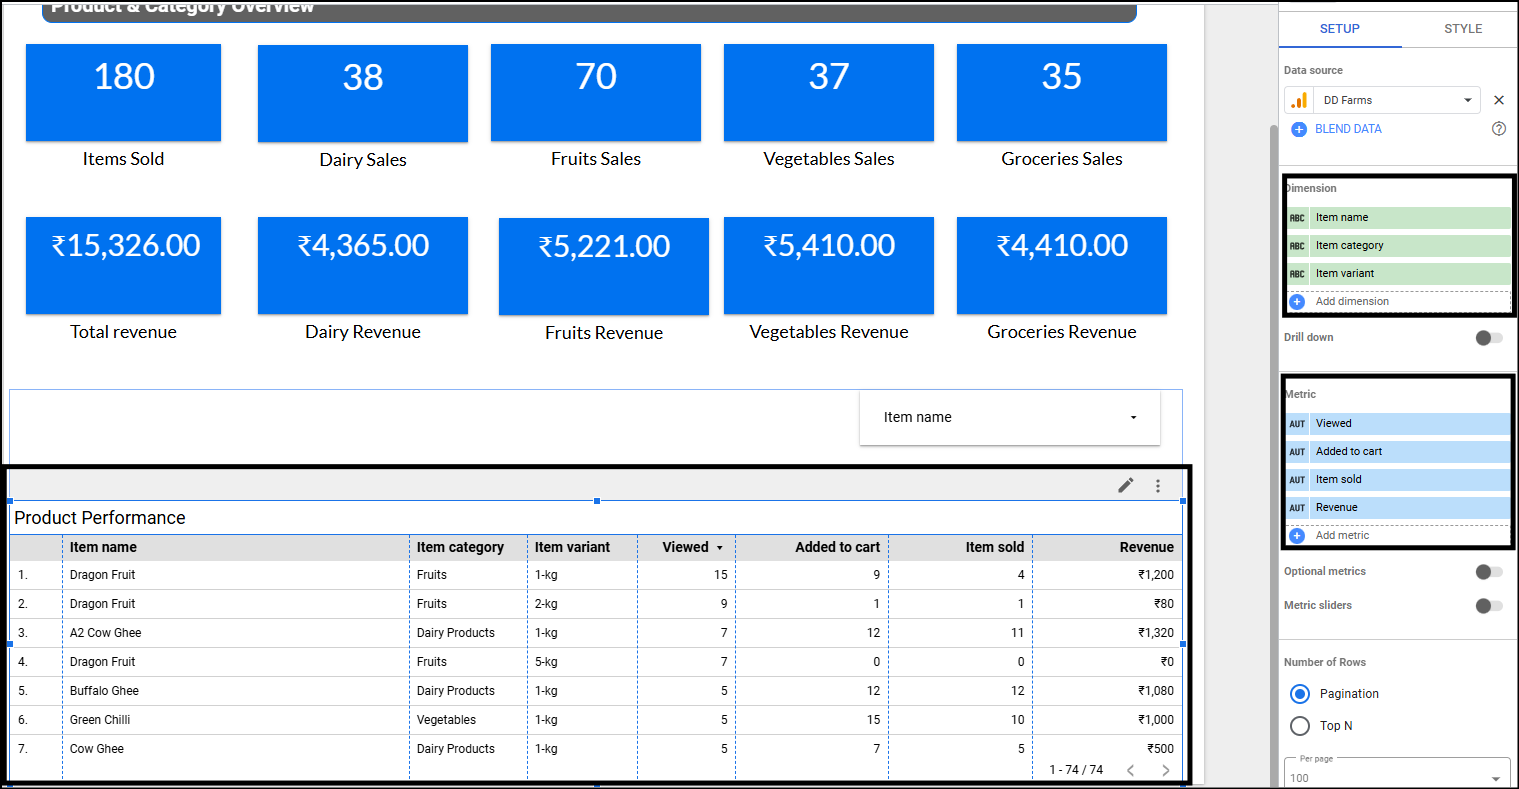
Total items sold
Scorecard chart. Metric – Items purchased.
Total revenue
Scorecard chart. Metric – Total revenue
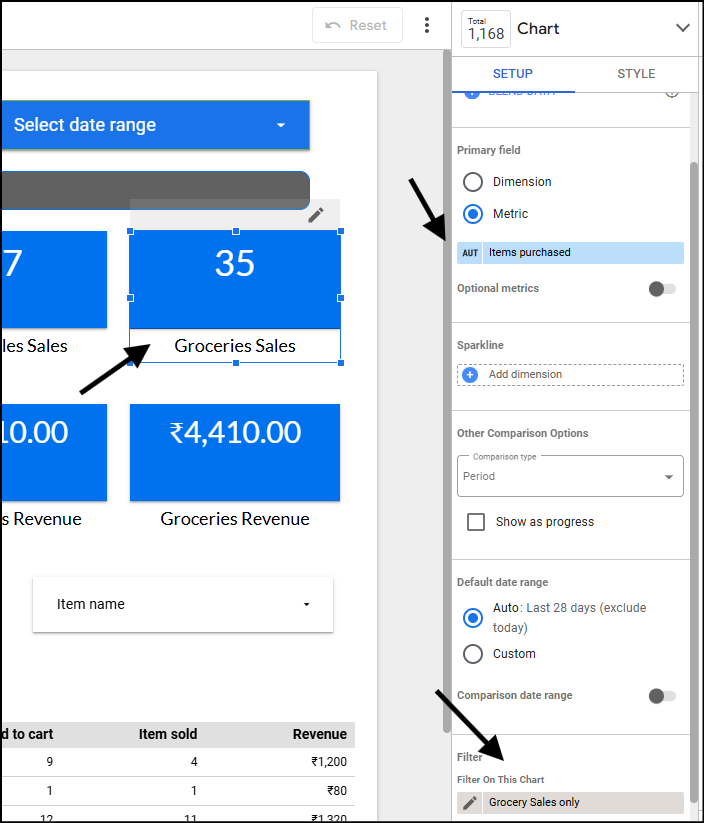
Dairy sales
- Chart – Scorecard
- Metric – Items purchased.
- Filter – Item Category equal to Dairy Products
Dairy Revenue
- Chart – Scorecard
- Metric – Total revenue.
- Filter – Item Category equal to Dairy Products
Fruit sales
- Chart – Scorecard
- Metric – Items purchased.
- Filter – Item Category equal to Fruits
Fruit revenue
- Chart – Scorecard
- Metric – Total revenue.
- Filter – Item Category equal to Fruits
Vegetable sales
- Chart – Scorecard
- Metric – Items purchased.
- Filter – Item Category equal to Vegetables
Vegetable revenue
- Chart – Scorecard
- Metric – Total revenue.
- Filter – Item Category equal to Vegetables
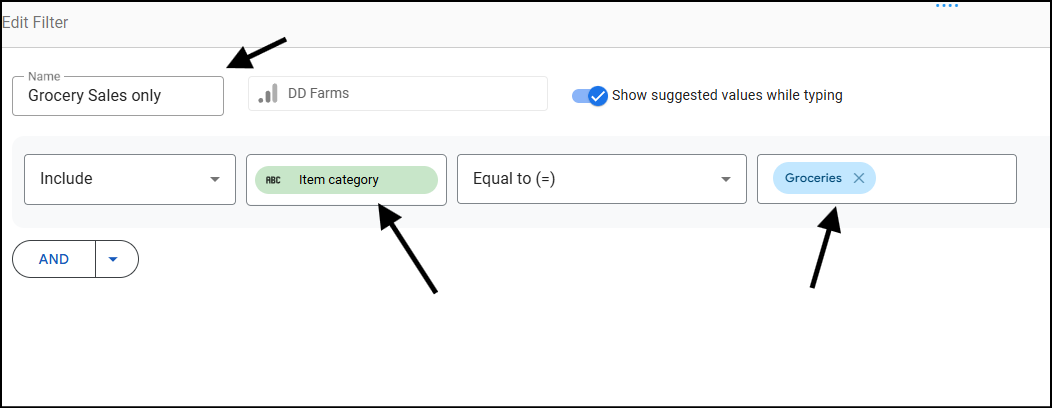
Grocery sales
- Chart – Scorecard
- Metric – Items purchased.
- Filter – Item Category equal to Groceries
Grocery revenue
- Chart – Scorecard
- Metric – Total revenue.
- Filter – Item Category equal to Groceries
Table
Product performance
- Chart – Table
- Dimension – Item name, Item Category, Item Variant
- Metric- Items viewed, Items added to cart, Items purchased, Item revenue
- Date range – Auto
Next Steps
Previous in the series: How Does Custom Event Tracking in GTM Work?
Also Read: Tracking WooCommerce Shop Performance using GA4, GTM and eCommerce Events